-
 Streams
-
Compute
- Overview
- Group By Ranges & Buckets
- Data Explorer Guide
- Video Completion Funnel
- Saved Queries
- Compute Pricing Guide
- Custom Ad Performance
- Session Timing Metrics
- Cohort Analysis
- Retention Analysis
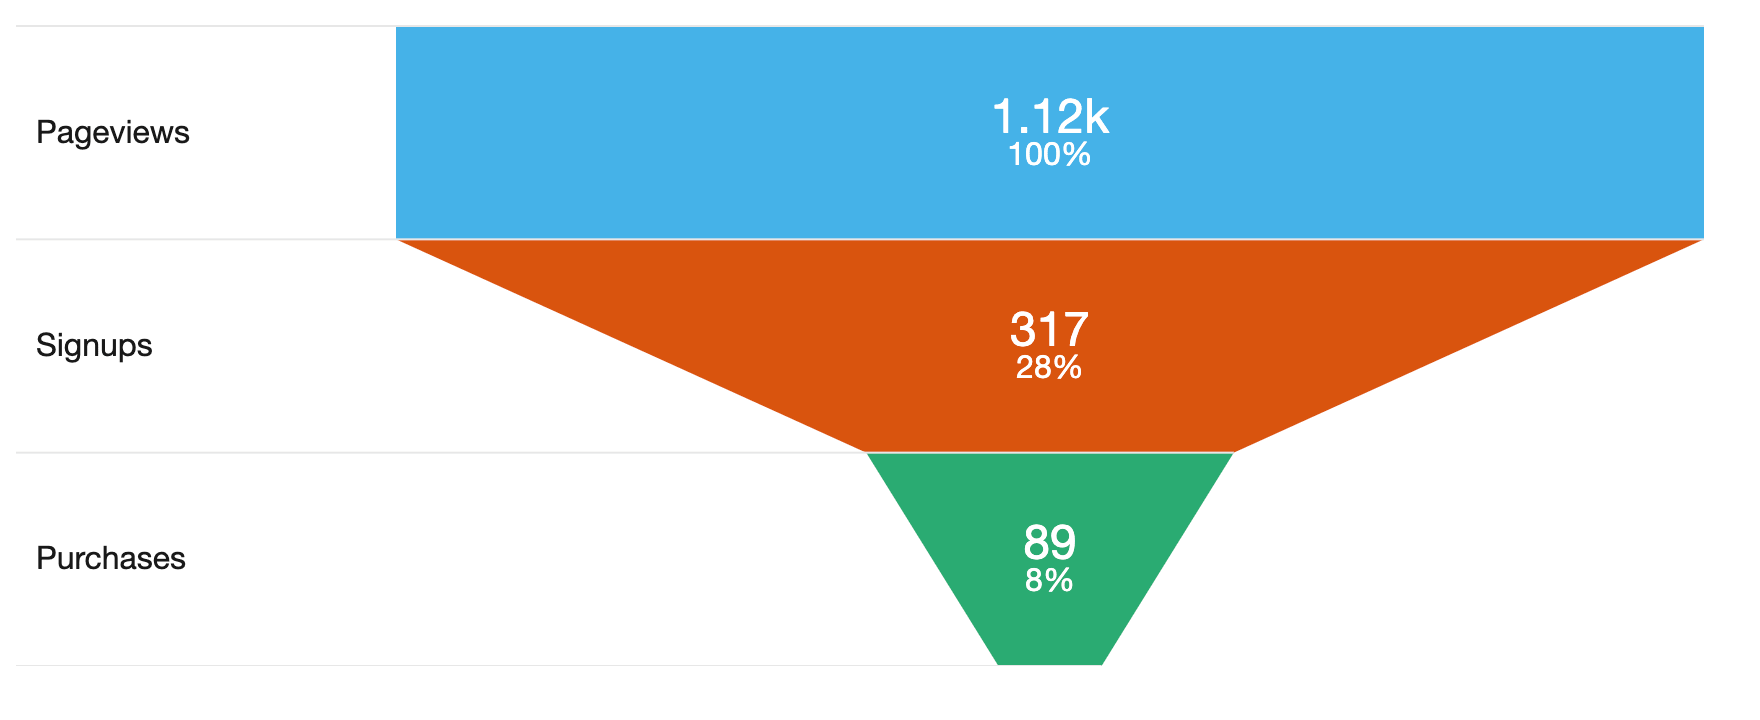
- Funnel Analysis
- Creating a Funnel with an OR Condition
- Stripe Revenue Queries
- Create a Email Nightly Report
- Query Tuning
- Cached Queries
- Cached Datasets
- Paid Session Metrics
- User Engagement
-
Visualize
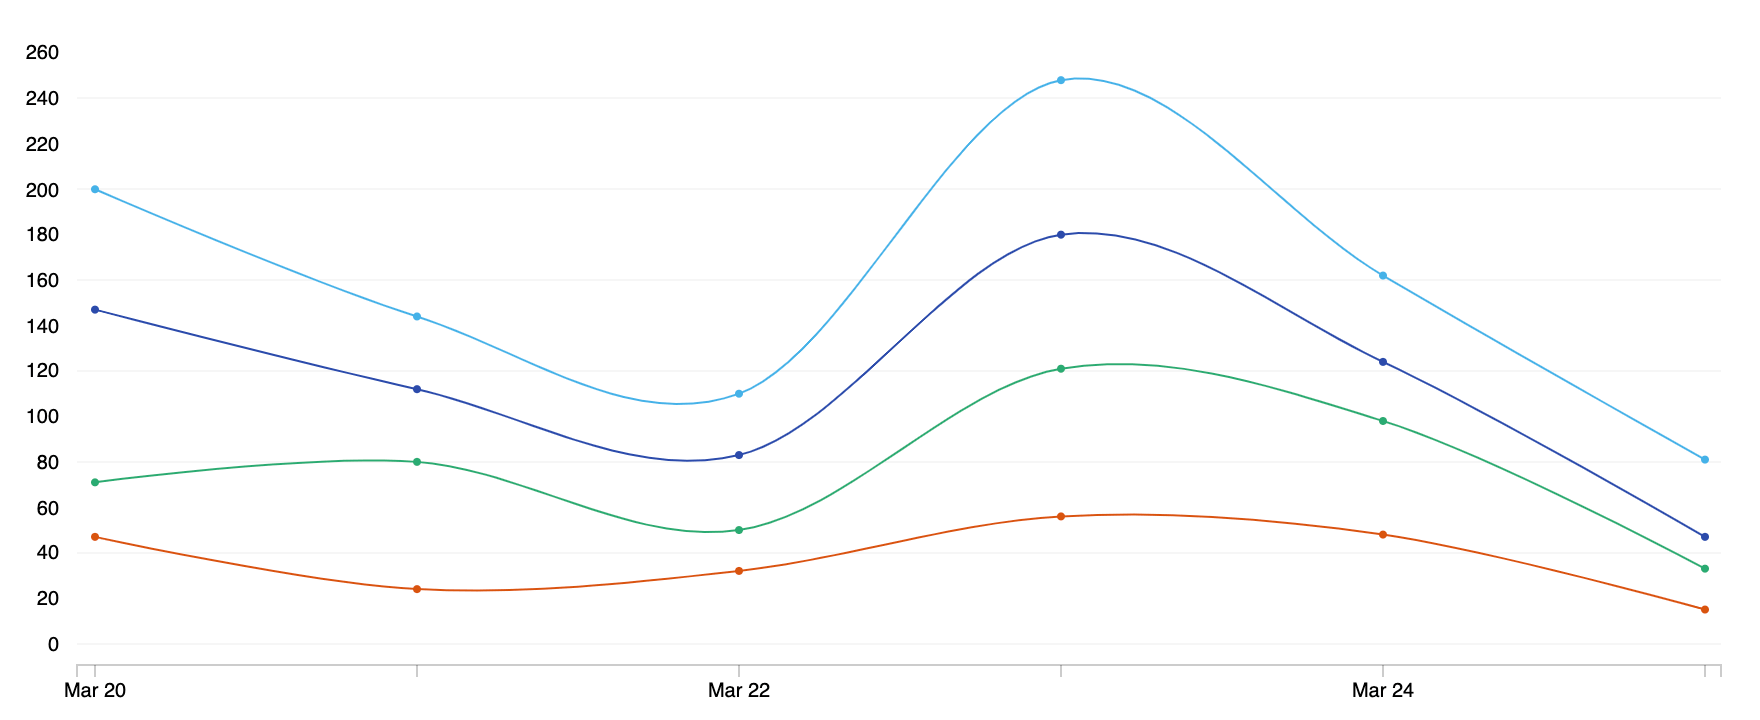
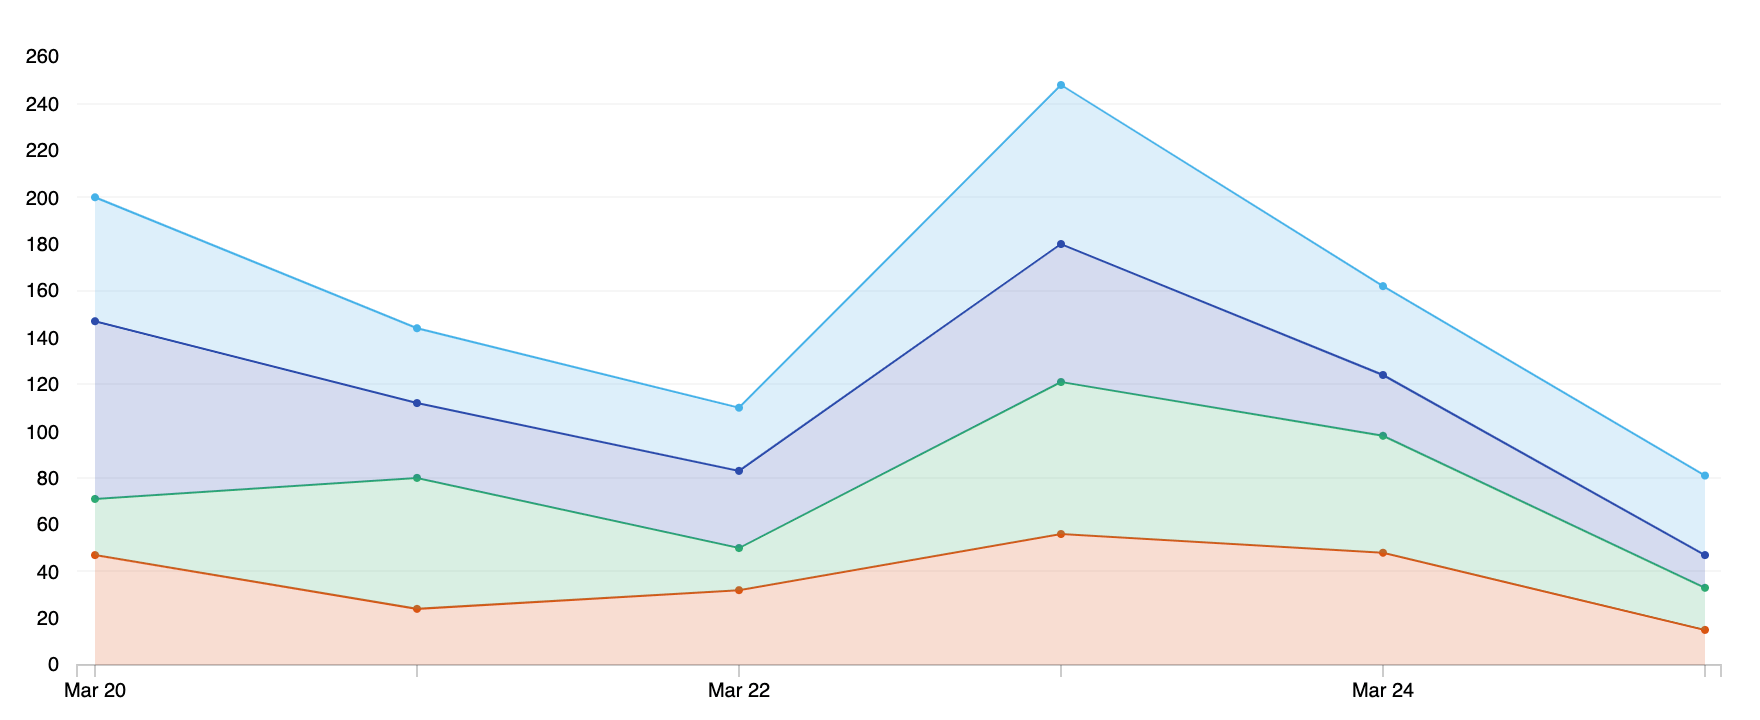
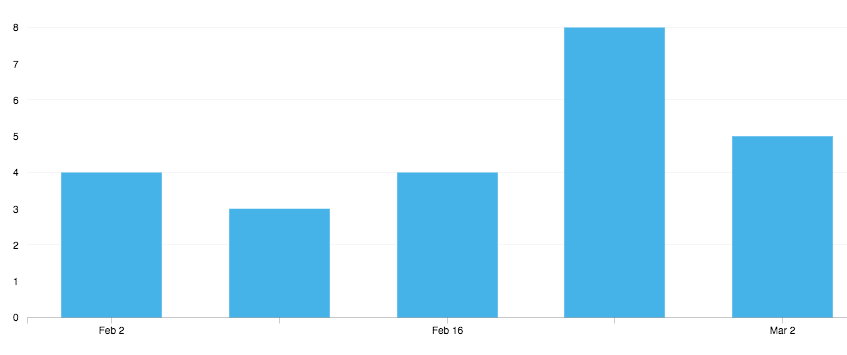
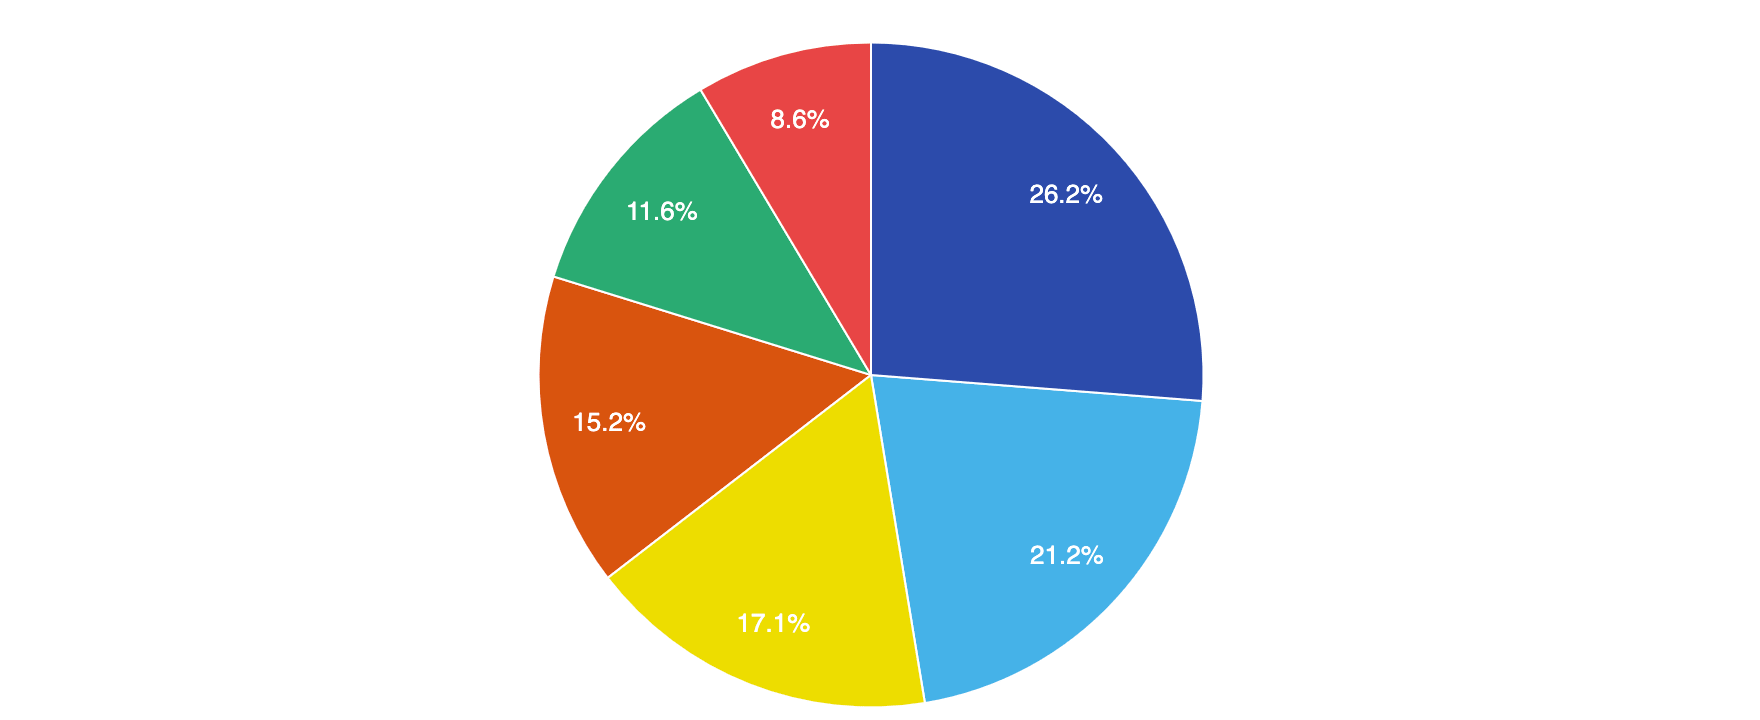
Chart Examples
You can create many different types of charts with Keen. We have provided some common chart examples with live data from the Keen Compute API below. The examples are bare bones and don’t have a lot of customization, but customization is totally possible! Check out the docs for how to customize your charts.
If you want to see more types of charts, see this section.
The examples below are using the keen-analysis.js and keen-dataviz.js library.