-
 Streams
-
Compute
- Overview
- Group By Ranges & Buckets
- Data Explorer Guide
- Video Completion Funnel
- Saved Queries
- Compute Pricing Guide
- Custom Ad Performance
- Session Timing Metrics
- Cohort Analysis
- Retention Analysis
- Funnel Analysis
- Creating a Funnel with an OR Condition
- Stripe Revenue Queries
- Create a Email Nightly Report
- Query Tuning
- Cached Queries
- Cached Datasets
- Paid Session Metrics
- User Engagement
-
Visualize
SendGrid Email Analytics
Store, Analyze, Visualize, & Report on SendGrid Email Event Data
SendGrid is an email infrastructure platform that lets you easily send transactional and marketing emails. Together with SendGrid we built an integration that allows you to receive all events that happen within an email, such as: Delivered, Opens, Clicks, Marked as Spam and lots more!
It only takes a couple of minutes to start streaming email event data from SendGrid to Keen, and once you do, we offer permanent storage for your email data and you can create flexible email analytics dashboards.
This guide covers:
- Send Your SendGrid Data to Keen
- Test Your Integration
- Embedding SendGrid Analytics Into Your App
- Additional Resources
Send your SendGrid Data to Keen
Step 1: Create a Keen and SendGrid account
- Create a Keen account (if you don’t already have one)
- Add a new project in the Keen UI for your SendGrid Email Event Data
- Copy your Project ID and API Write Key from the Access tab
- Create a SendGrid account
Step 2: Configure Keen + SendGrid Integration
Log into your SendGrid account, click on Settings from the left menu → Select Mail Settings. Then click on “Event Webhook”.
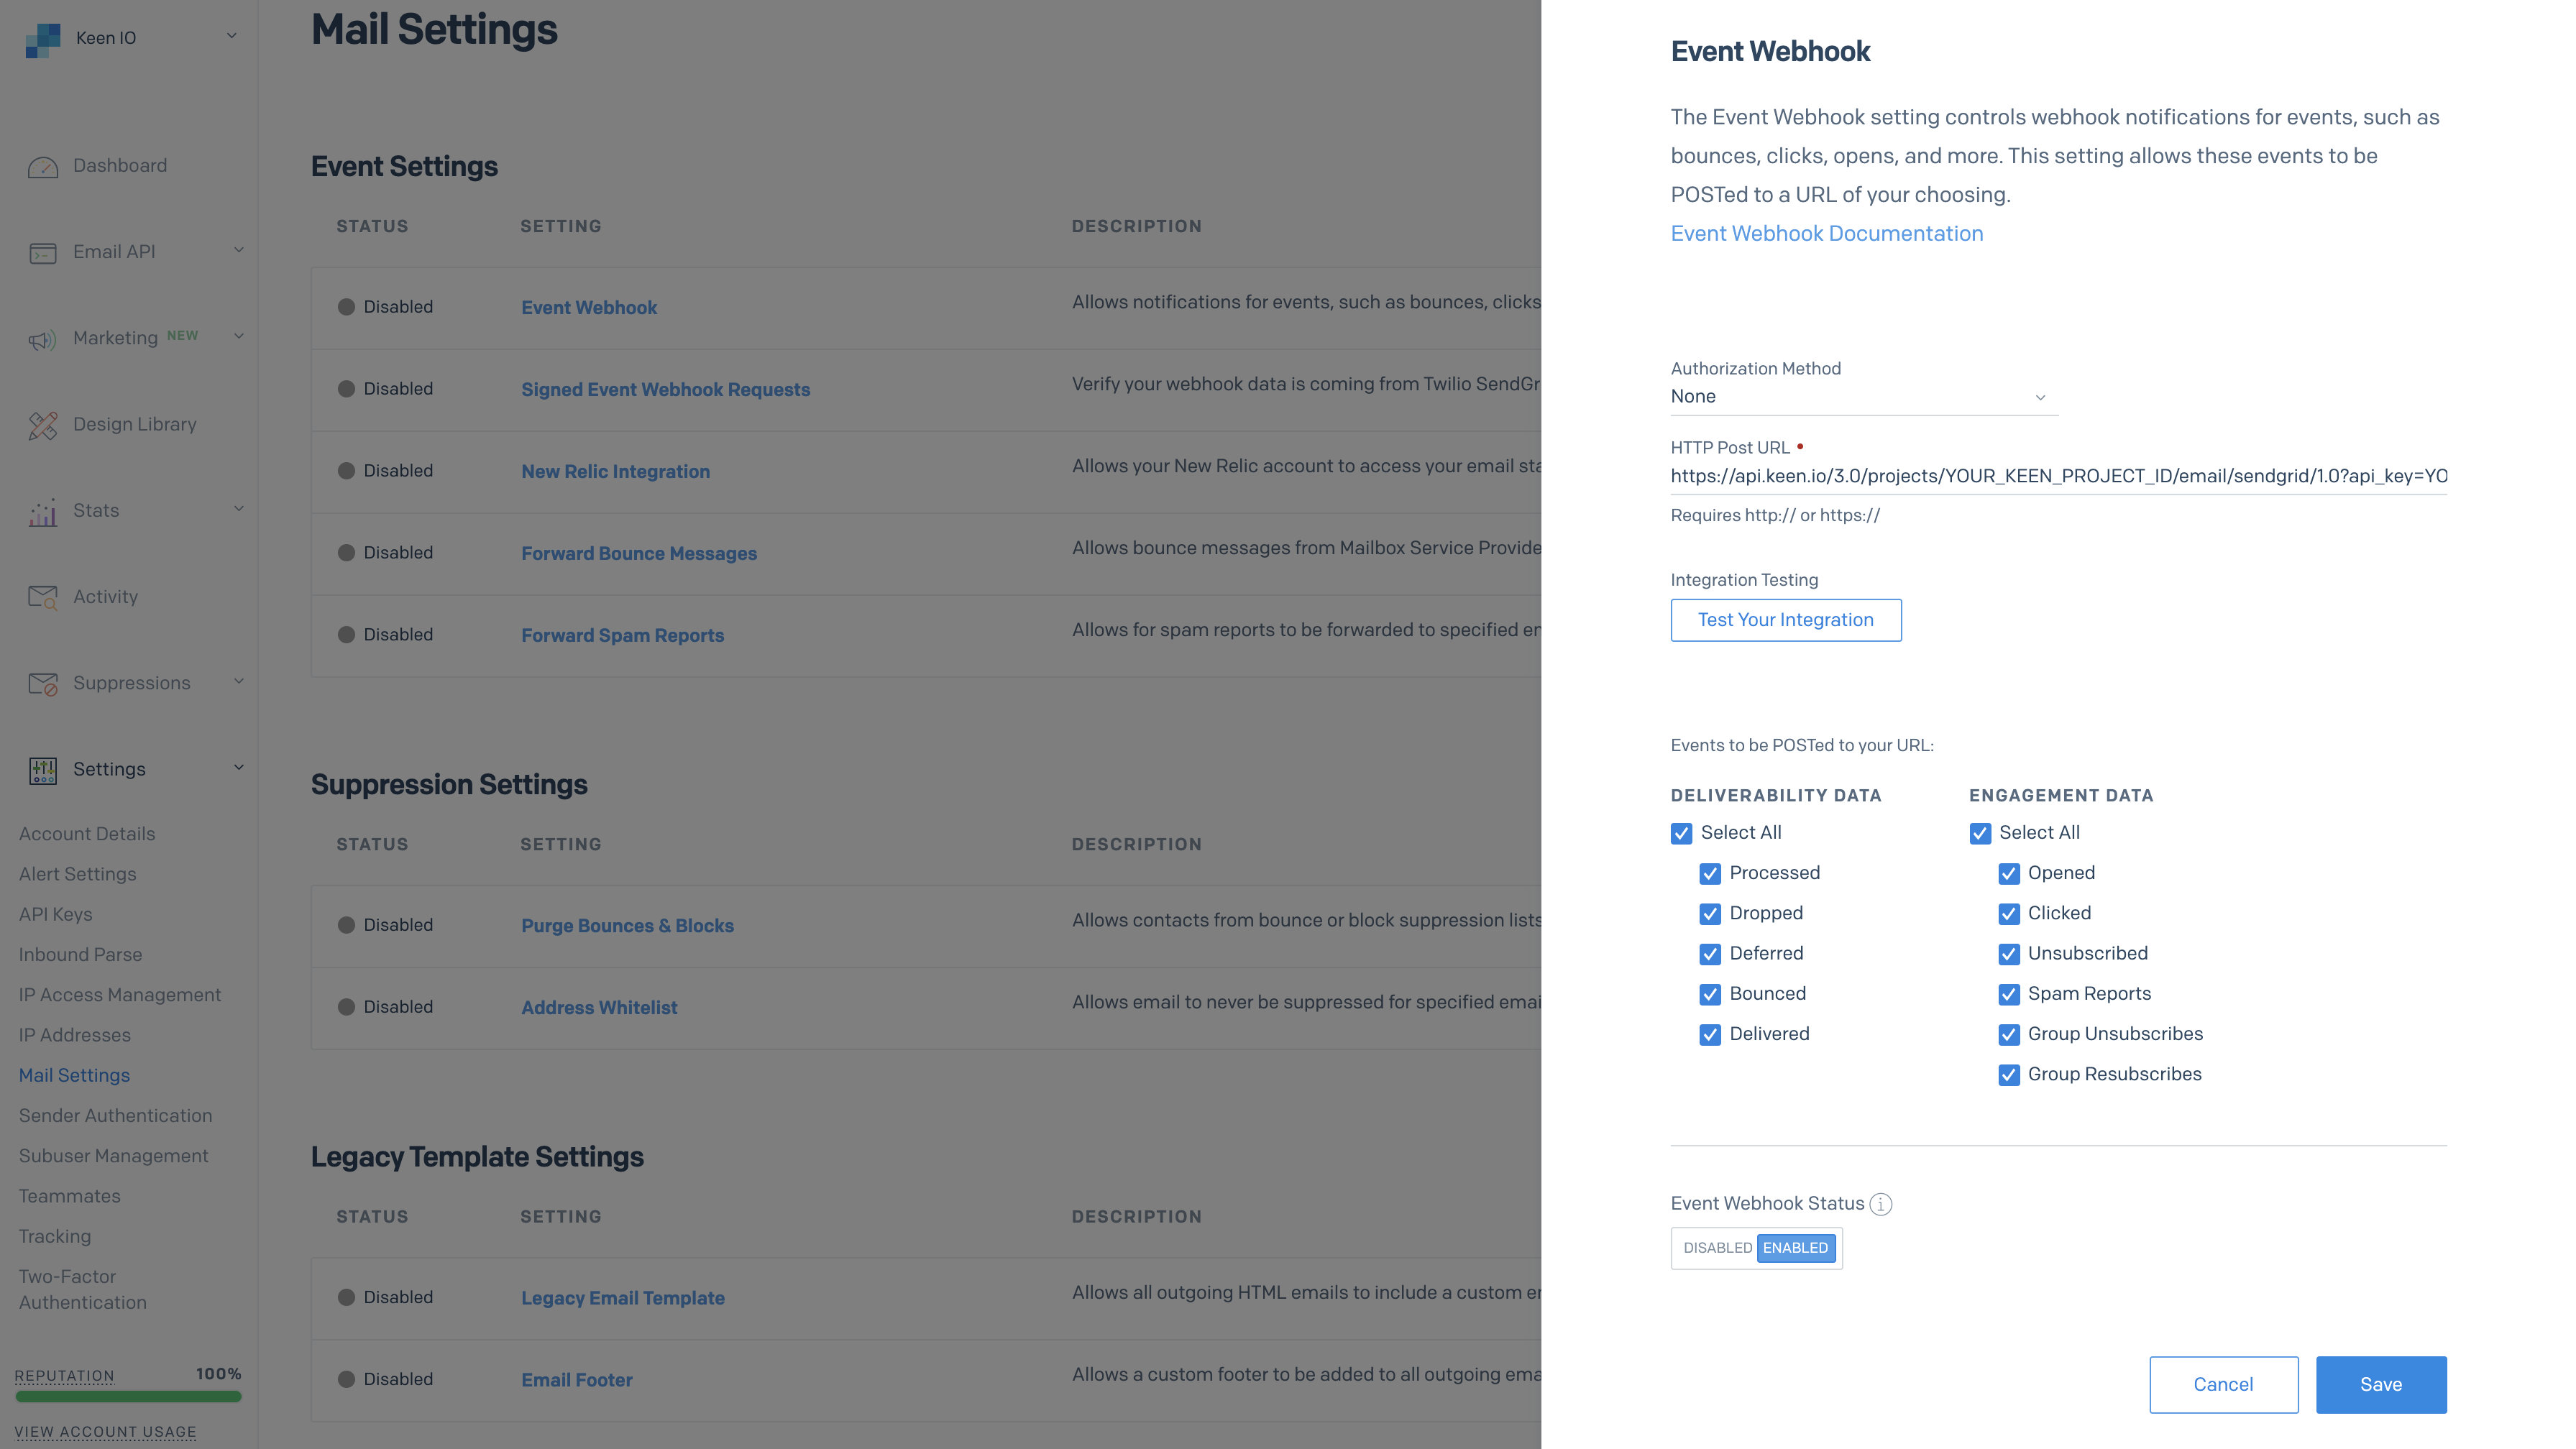
Step 3: Set the HTTP POST URL (example below) as the endpoint where SendGrid will stream all of your email data.
https://api.keen.io/3.0/projects/YOUR_KEEN_PROJECT_ID/email/sendgrid/1.0?api_key=YOUR_KEEN_API_WRITE_KEY
Copy and paste the above URL into the HTTP POST URL field. Make sure to replace YOUR_KEEN_PROJECT_ID and YOUR_KEEN_API_WRITE_KEY with your Project ID and API Write Key available in the Access tab. Set Authorization Method to None.
In the settings, select the events you want to post to Keen (why not all of them?). To do this, check “All” under the “Select Actions.” You can refer to SendGrid’s event documentation for more information on these events.
That’s it! Now, as your emails make their way through SendGrid, all of the event information will be posted to Keen. A new Event Collection, aptly named for each type of email event, will be created within your Keen Project.
Test Your Integration
Test that everything is working by clicking on the “Test Your Integration” button in SendGrid’s “Event Webhook” Settings. This will send sample email data from SendGrid into your Keen Project. In the Keen UI, check the Streams tab for sample SendGrid data.
Enable the Event Webhook and your SendGrid email data should now be sent to Keen.
Your Data: SendGrid Data Models
The data model in this integration has been significantly upgraded from previous versions. A separate Event Collection, aptly named for each type of email event, is created within your Keen Project. Under SendGrid Event Notification Settings, each email event type that is selected will be recorded as a separate Event Collection in Keen. We recommend selecting “All” to access full functionality of the app’s reporting.
The email events that are recorded are:
email_bounceemail_clickemail_deferredemail_deliveredemail_droppedemail_group_resubscribeemail_group_unsubscribeemail_openemail_processedemail_spamreportemail_unsubscribe
As data streams to Keen, default data is enhanced via our Data Enrichment capabilities. Data models for these email events are enriched with IP to Geo information, DateTime parser, URL parser, and User Agent enrichment.
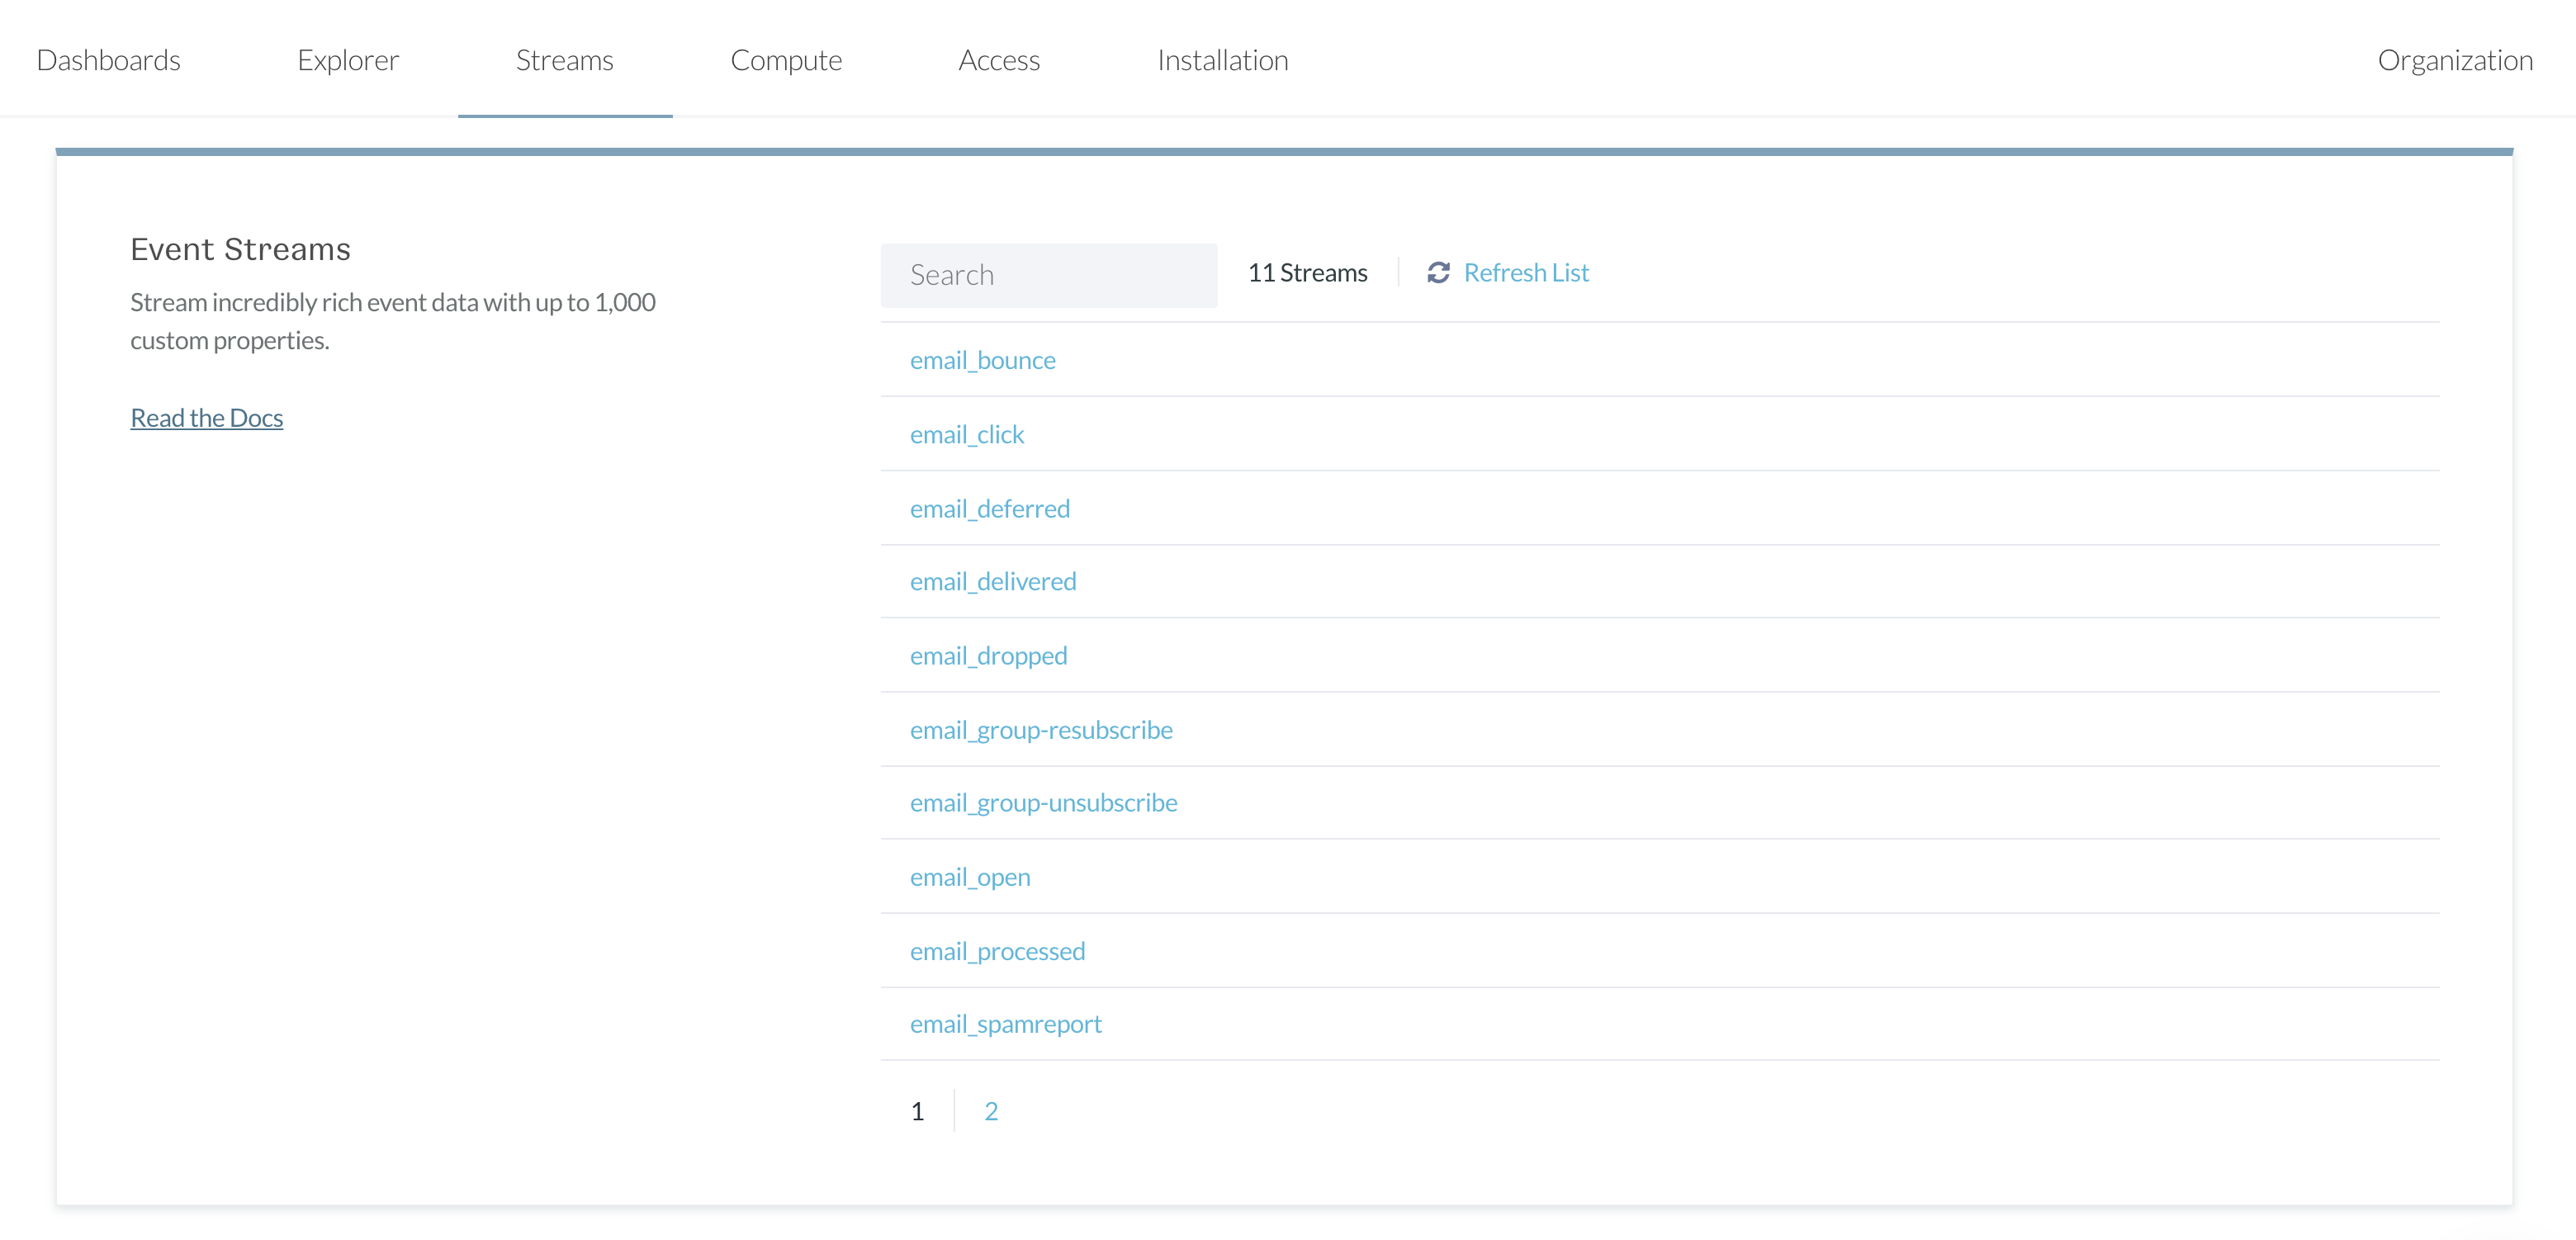
To explore each data model, Log into your Keen account, select your Project and open the “Streams” tab. In the search bar type in “email” to check out your data collections associated with SendGrid email data.
Tips: Use the property message_id contained in each event to track a particular email across all of these possible actions. Similarly, you can follow a particular users' behavior via the email property.
How to Use the Data Explorer
Step 1: Log into your Keen account, select your Project
Open the “Streams” tab. In the “Event Streams” search bar type in “email” to check out your data collections associated with SendGrid email data. A separate Event Collection, aptly named for each type of email event, is created within your Keen Project.
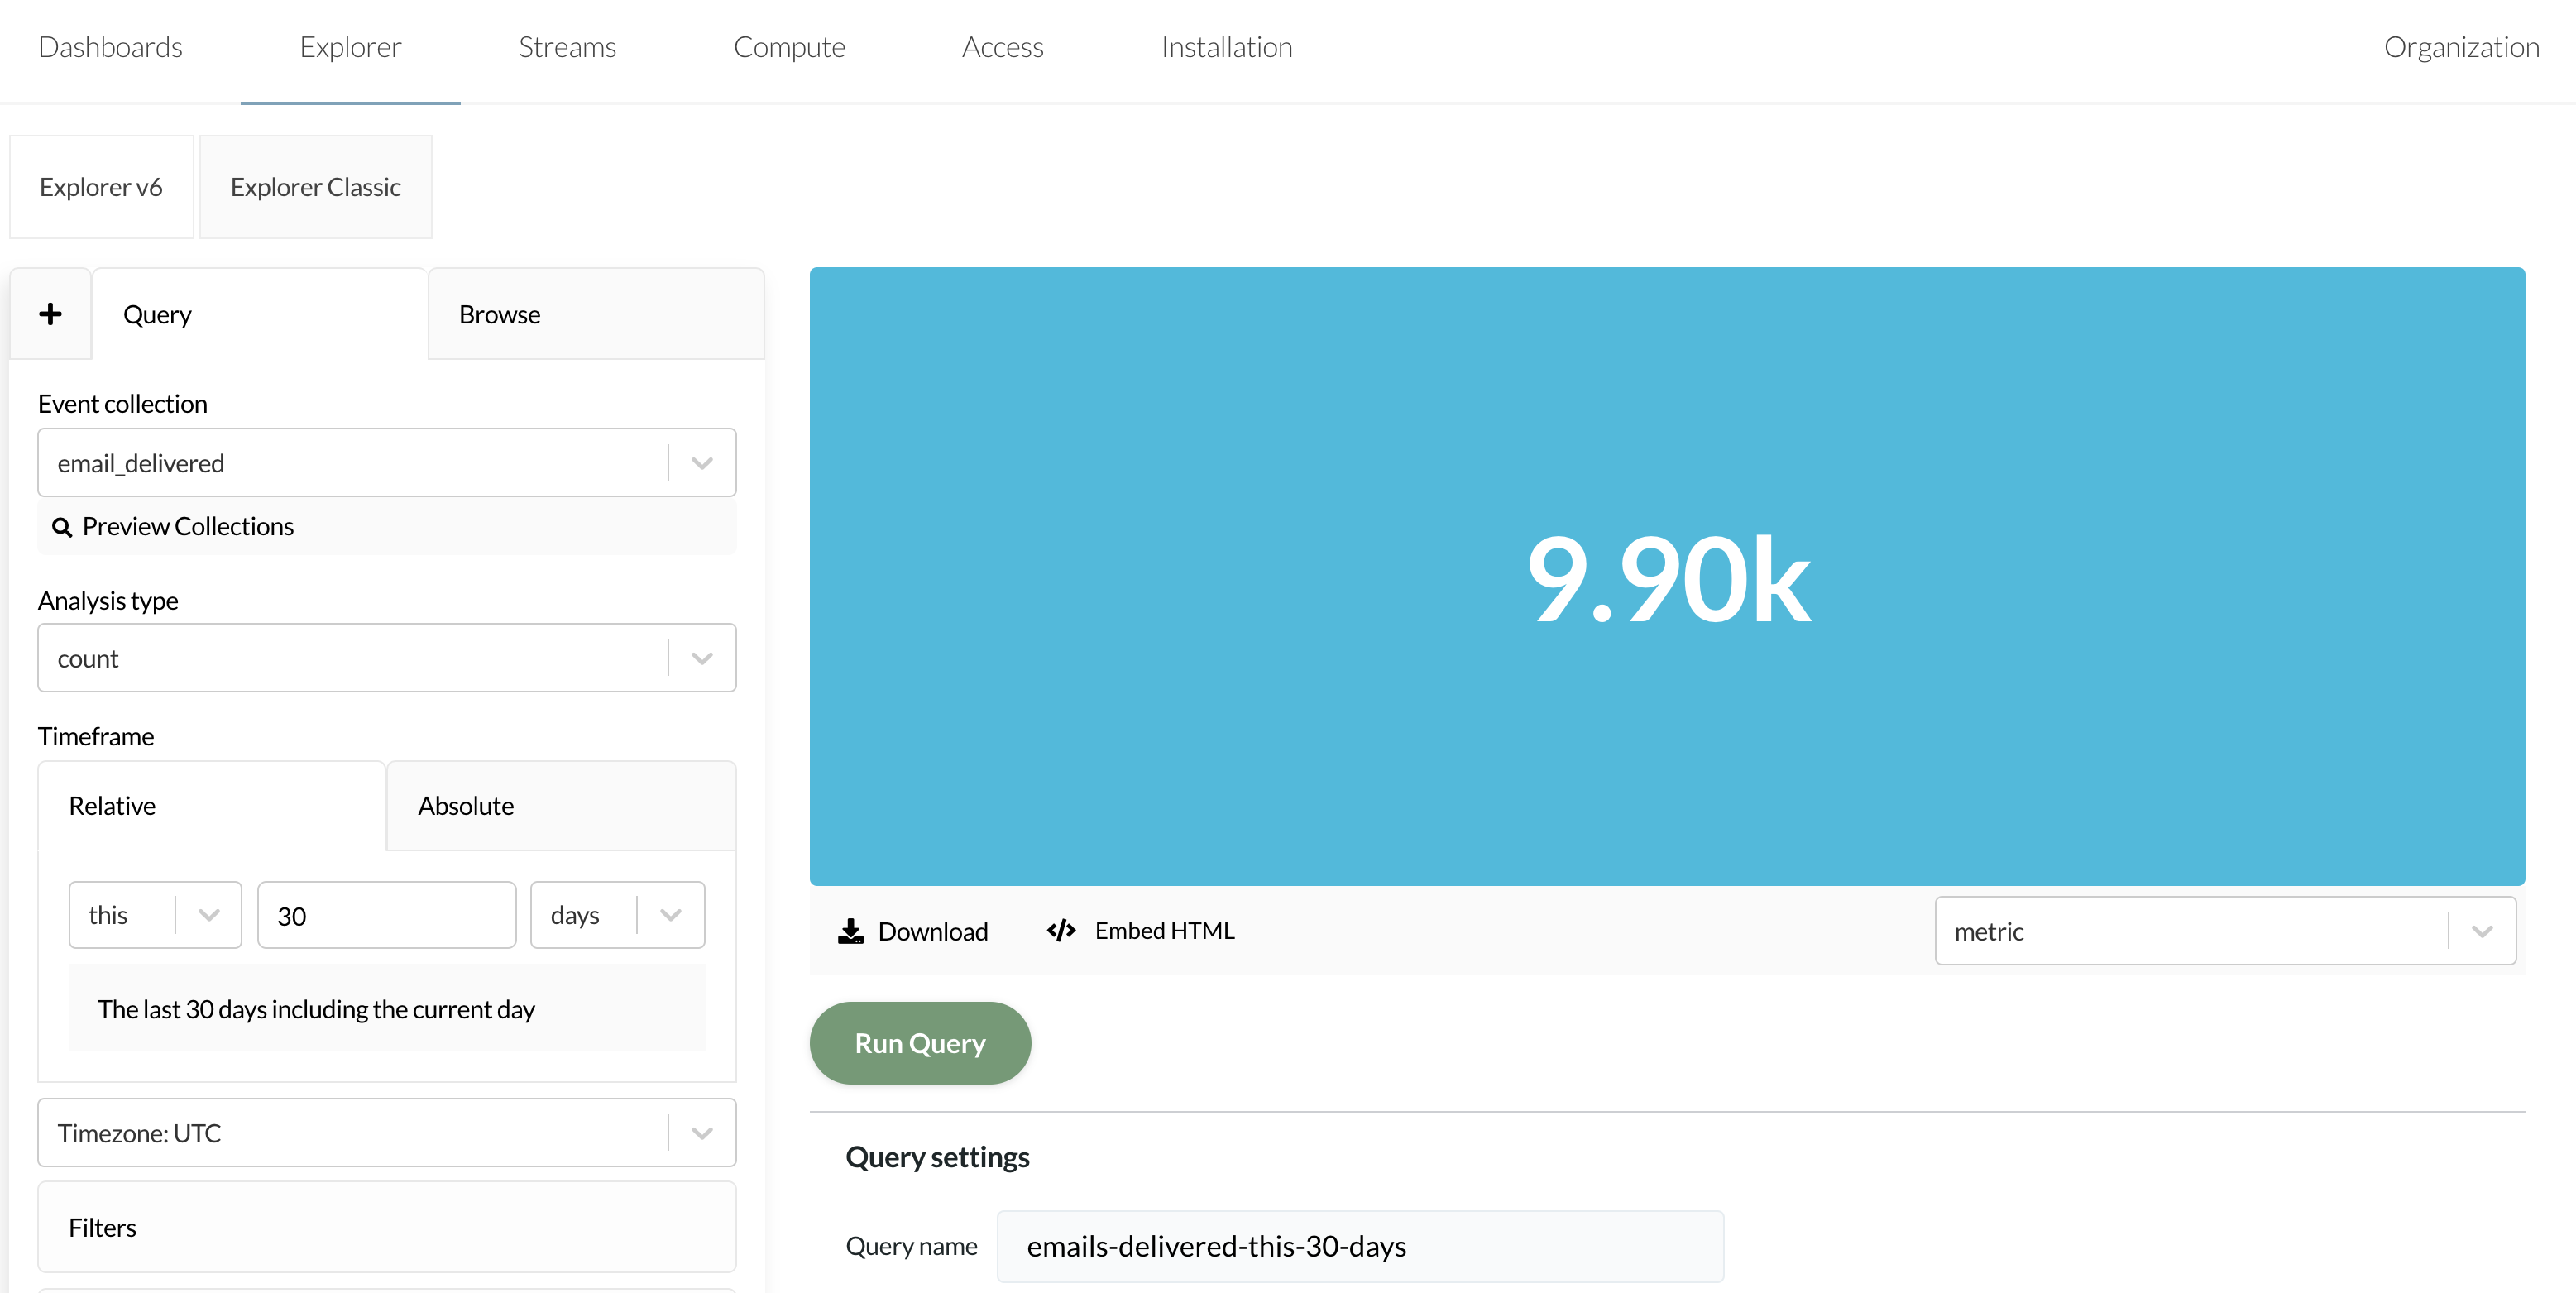
Step 2: Run some basic queries
Open the “Explorer” tab and enter count as the “Analysis Type,” select email_delivered as your “Collection Name,” and press “Run Query.” You ran a query!
The breadth of analysis you can do is pretty vast. Here’s a link to read up on the types of queries you can do with Keen. Some example query types are sums, averages, min or max, funnels, and select_unique.
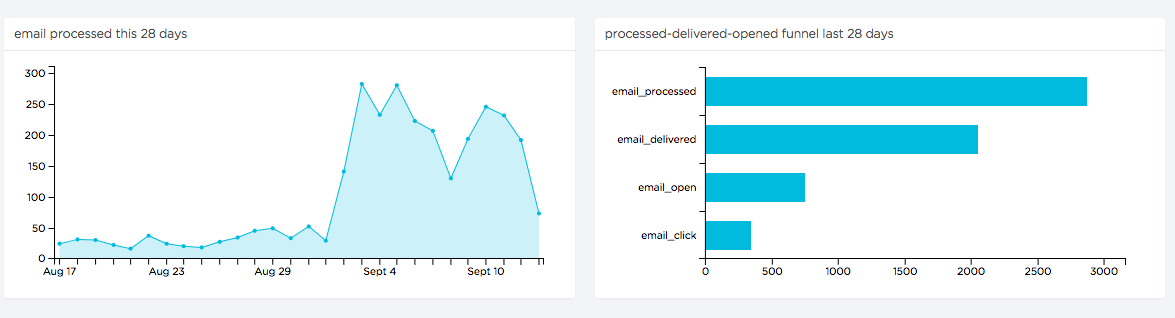
For some extra-pretty graphs and custom analyses here are some tips:
- Adding an “Interval” (e.g. “daily”) will give you a line graph over time (Ex. Number of emails processed daily for the previous 30 days)
- Include a “Group By” property (e.g. “campaign”) to view results categorically
- Use “Filters” to refine the scope of your query
- Use the chart type drop down on the upper right to choose how you view data: as an area graph, bar chart, column chart, table, or more
- Download a CSV of the data you found by clicking on the “Download CSV” button
Save Your Query & Make Your First Dashboard
Do you often run the same analysis on a regular basis, or want to be able to save a quick link to your work to revisit again sometime?
Once you’ve found the query you need, you can either copy the URL right from your browser’s address bar and share it with a colleague, or you can save the query and make yourself a dashboard with Keen.
Here’s how:
Step 1: Let’s save your query. Create your query in the Explorer and click “Run.” After running the query, press “Save.”
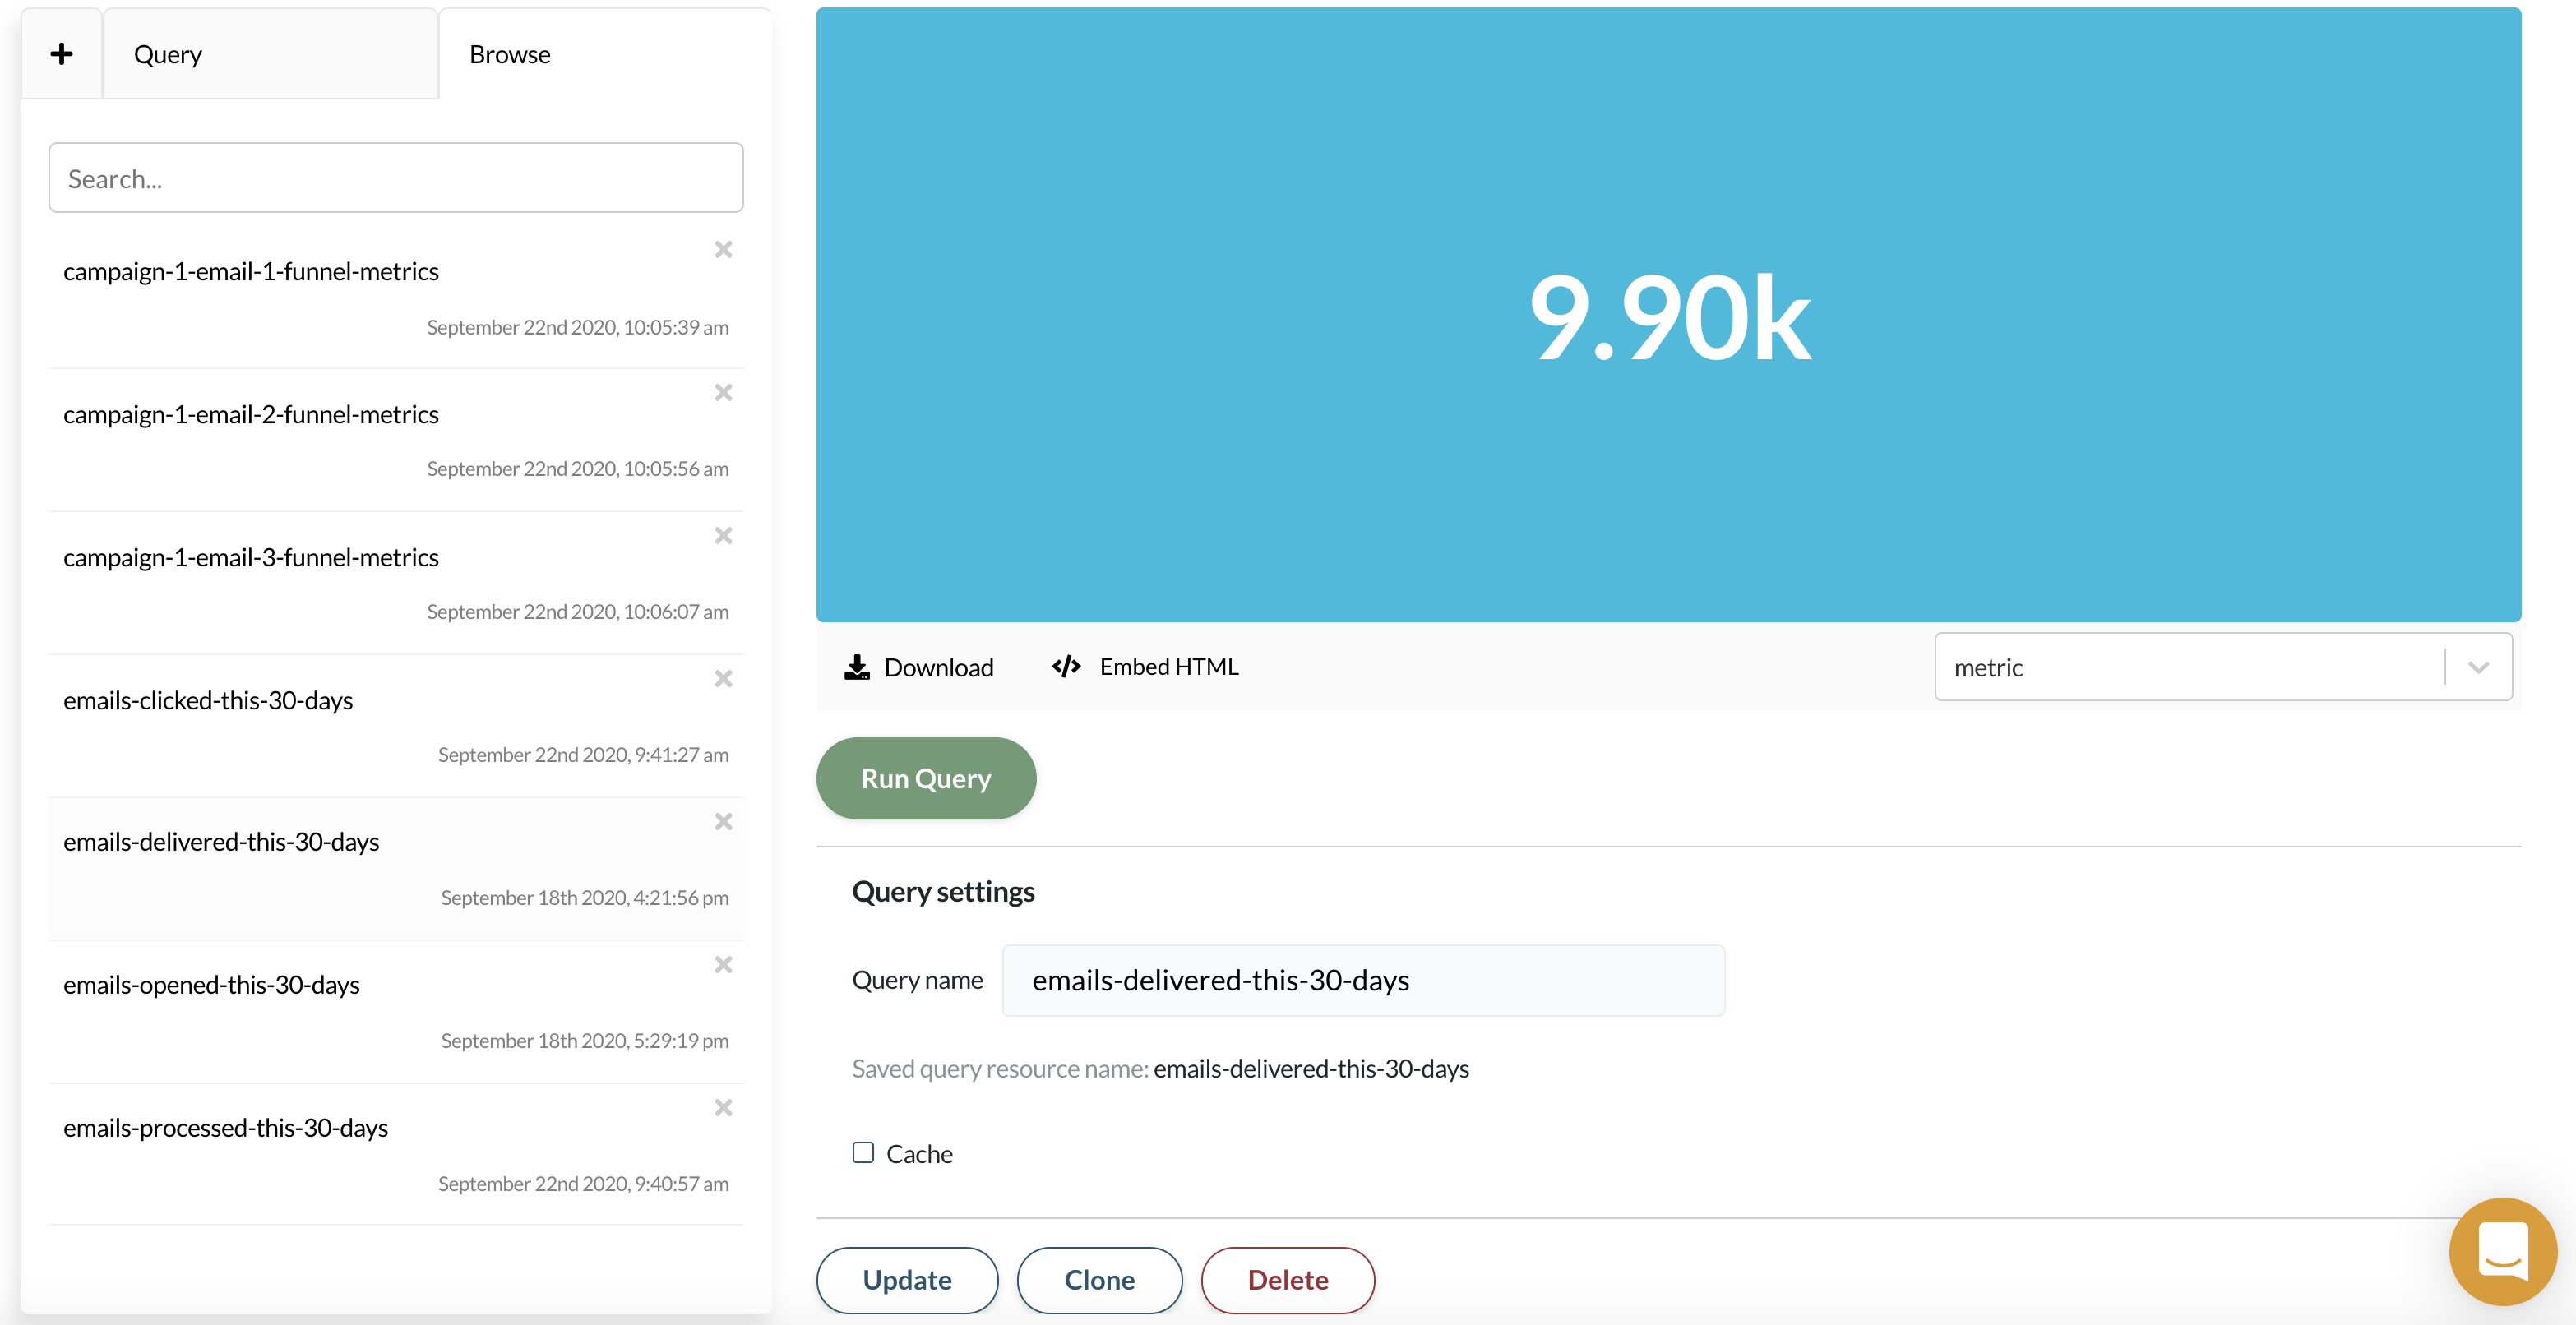
Saved queries are a super user-friendly way to revisit your favorite metrics. Rather than entering the same query parameters over and over again, queries can be shared with your teammates. Notice that your saved query can be edited and cloned.
Step 2: Add your graph to a dashboard. Select “Create Dashboard,” name your dashboard, and add the query we saved to the first tile. Then click “Save.”
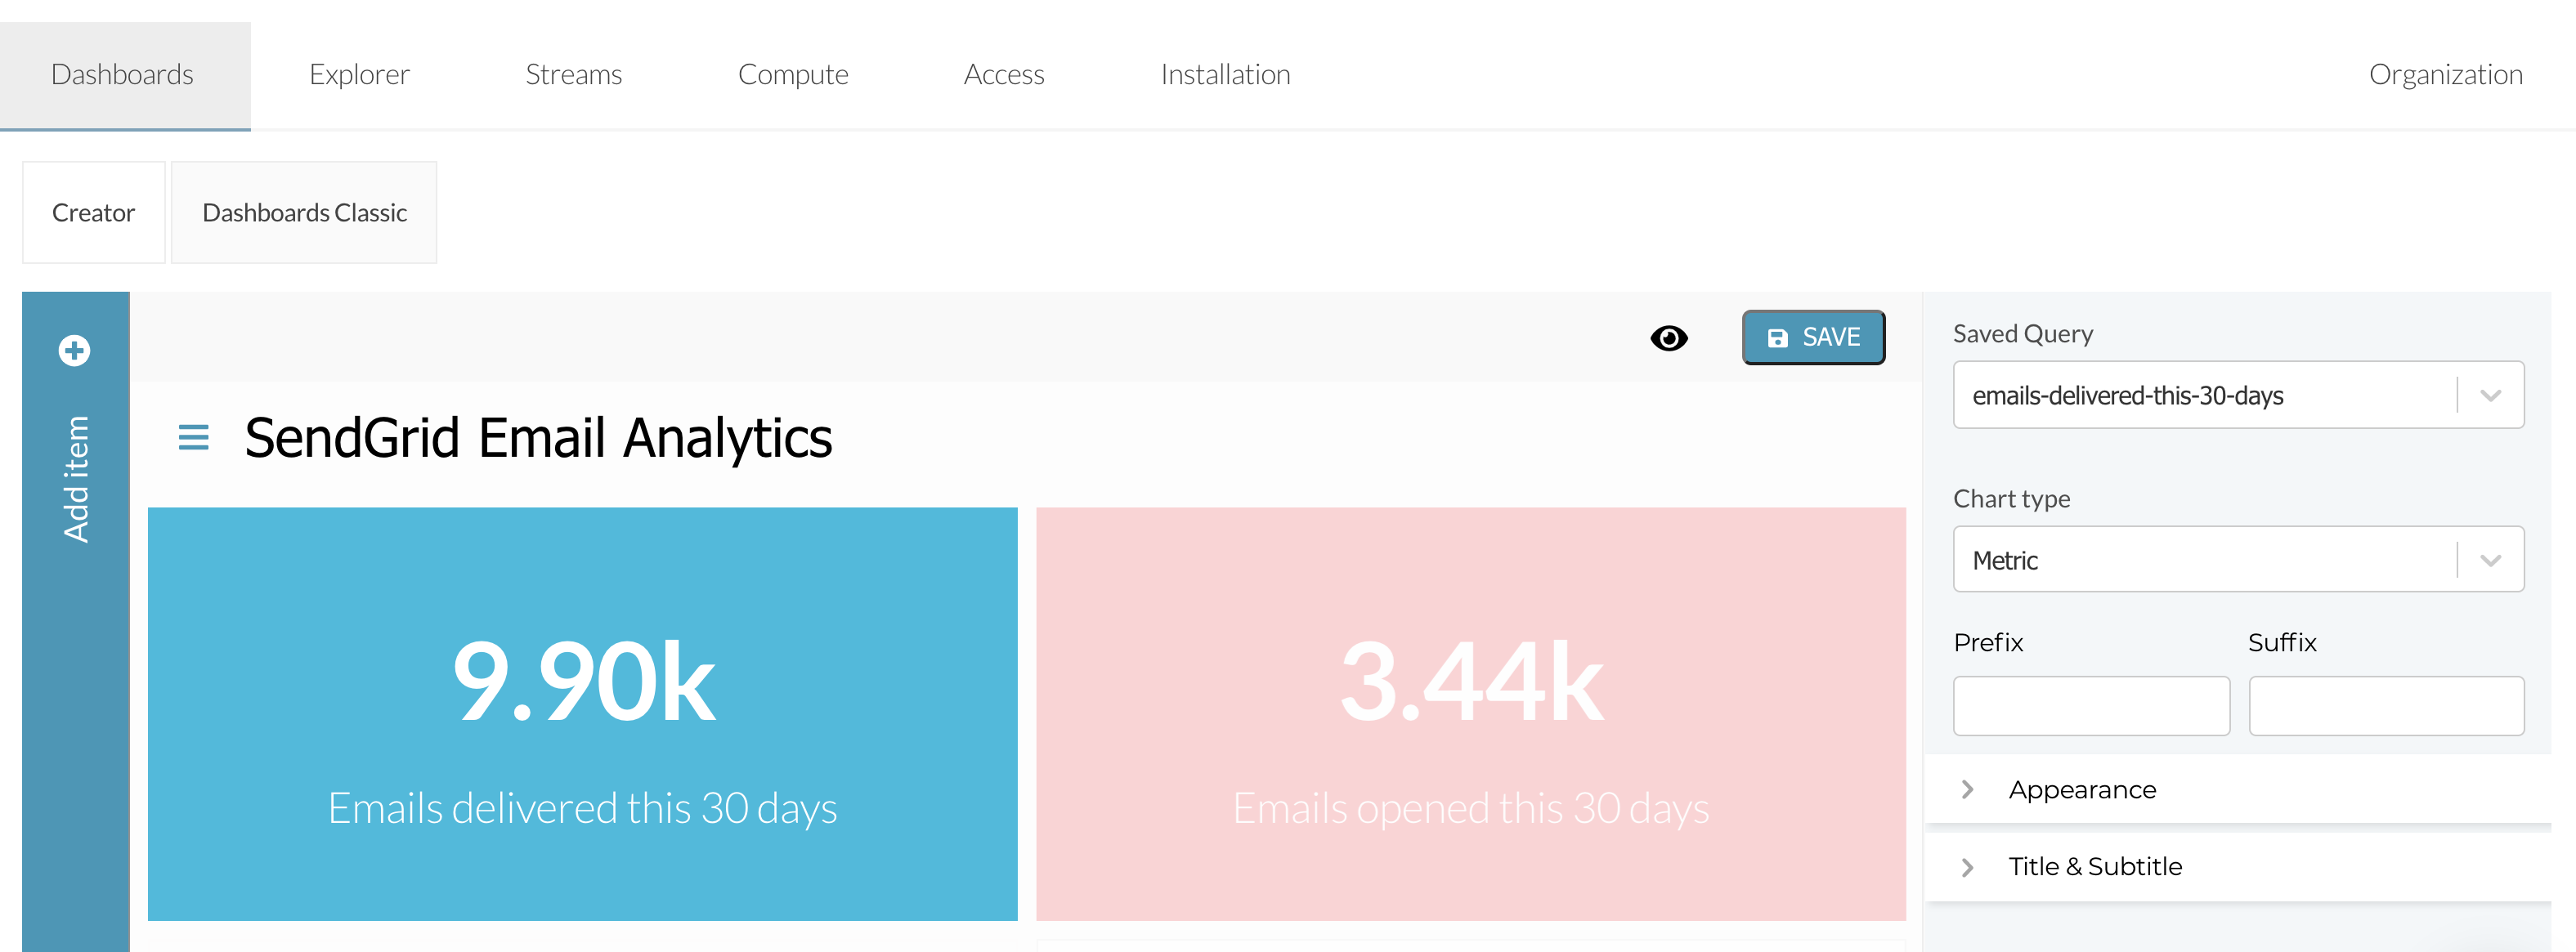
Congratulations! You’ve created your first dashboard!
Embedding SendGrid Analytics Into Your App
With Keen, you will have access to all of your raw data for as long as you need it. An archive of all of your email data is created, which means you will have access to your historical data and can query for past user behavior.
Just like SendGrid, Keen is 100% powered by APIs. This means you can embed rich analytics anywhere you can write code.
Many customers find it useful to embed analytics into their products for their customers or customer success teams. Here’s a link to our Customer Facing Analytics Guide that will give you step-by-step instructions on how to embed your SendGrid analytics into your product. Some customers also take advantage of Keen’s S3 Streaming capabilities to write a copy of all their data to AWS.
Additional Resources:
- SendGrid’s complete Event Webhooks Documentation is a great resource on SendGrid email events. As you start to do more analysis, it’s worth a read. You can even skip a lot of the sections because we’ve done much of the work for you.
- Build a campaign and email marketing dashboard. Create and display your email metrics using one of our dashboard templates.
