-
 Streams
-
Compute
- Overview
- Group By Ranges & Buckets
- Data Explorer Guide
- Video Completion Funnel
- Saved Queries
- Compute Pricing Guide
- Custom Ad Performance
- Session Timing Metrics
- Cohort Analysis
- Retention Analysis
- Funnel Analysis
- Creating a Funnel with an OR Condition
- Stripe Revenue Queries
- Create a Email Nightly Report
- Query Tuning
- Cached Queries
- Cached Datasets
- Paid Session Metrics
- User Engagement
-
Visualize
Postman Integration
Push Monitor results into Keen Streams for API-based computation & S3 backups
When you activate this integration, we will stream your Monitor results from Postman into Keen Streams. Once connected, you can use Keen for API-based computation, S3 backups, and building visualizations or dashboards. You can:
- Build dashboards for your team, or directly into your product using Keen Compute
- Backup your Postman Monitor Data to Amazon S3. Once data is in S3, you can route your events to any third-party service or trigger event-based actions via AWS Lambda.
To integrate Postman Monitors data with Keen, follow the steps below. It should take about 2 minutes.
Step 1: Create a Keen project
Log In to Keen
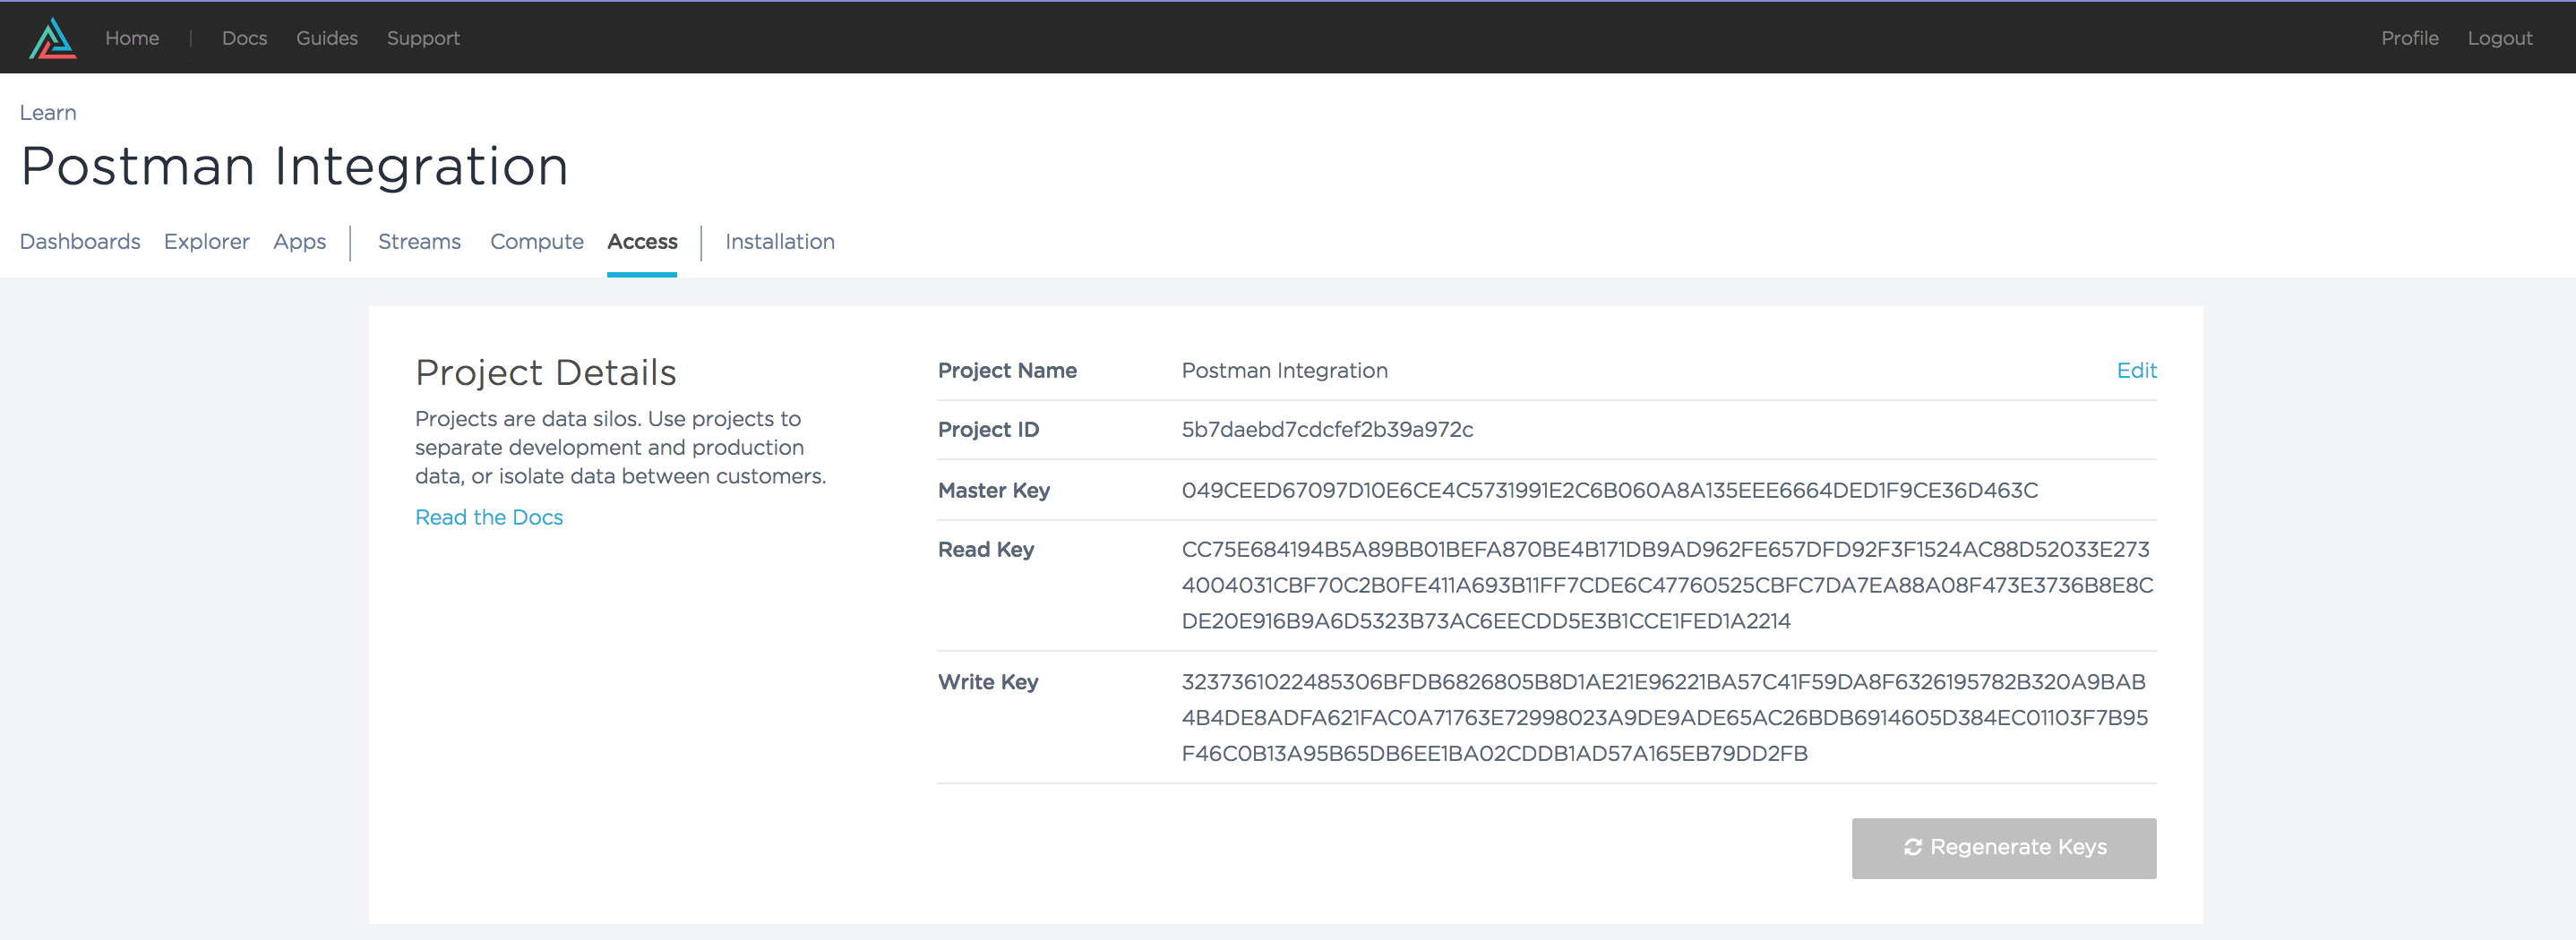
Find the Organization & Project you’d like to stream Postman Monitor data to. Go to “Project Settings” –> select “API Keys”
Take note of your “Project ID” and “API Key” for Step 2
Step 2: Hooking up the Integration
Log into Postman
-
On the left side of the screen, select one of your “Collections”. In Postman, a collection is a grouping of individual API requests. In this example collection, we’re pinging the Google Maps API for location data, then asking the Weather Company API for weather data, and lastly posting the results to Slack via their API.
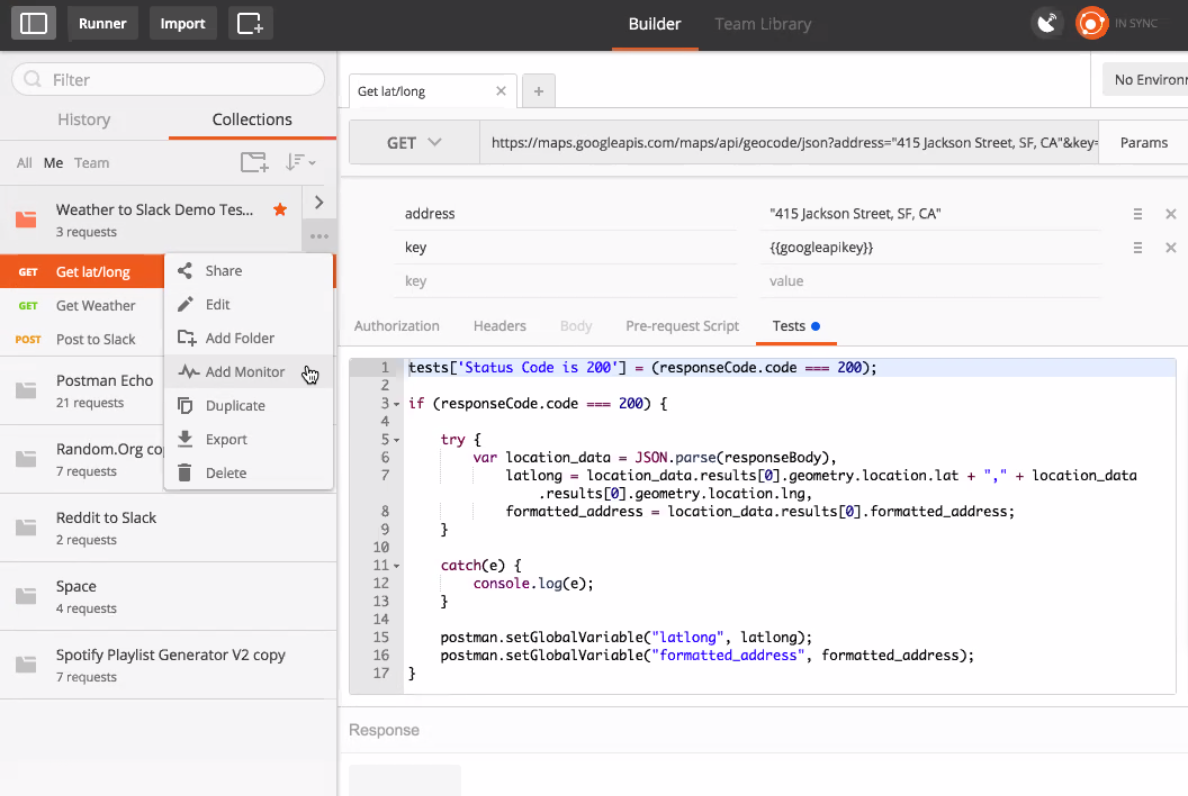
Use the drop-down menu to create a “Monitor” for your Collection. Postman Monitors allow you to schedule tests associated with your API calls and check for proper logic, error handling, and logic. In addition, you can observe the uptime and performance of your API requests.
-
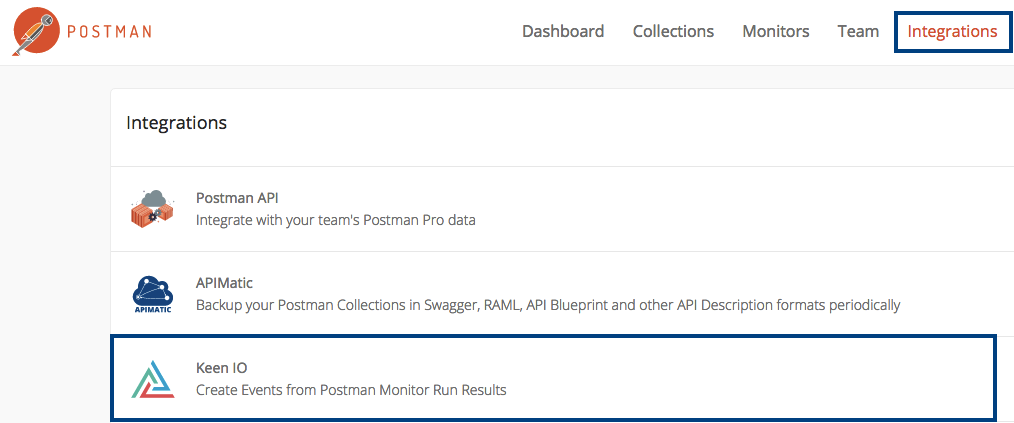
Within the Postman Web UI, select the Keen Integration
-
Choose a Monitor, Enter in your Keen Project ID and API Key that we found in Step 1.
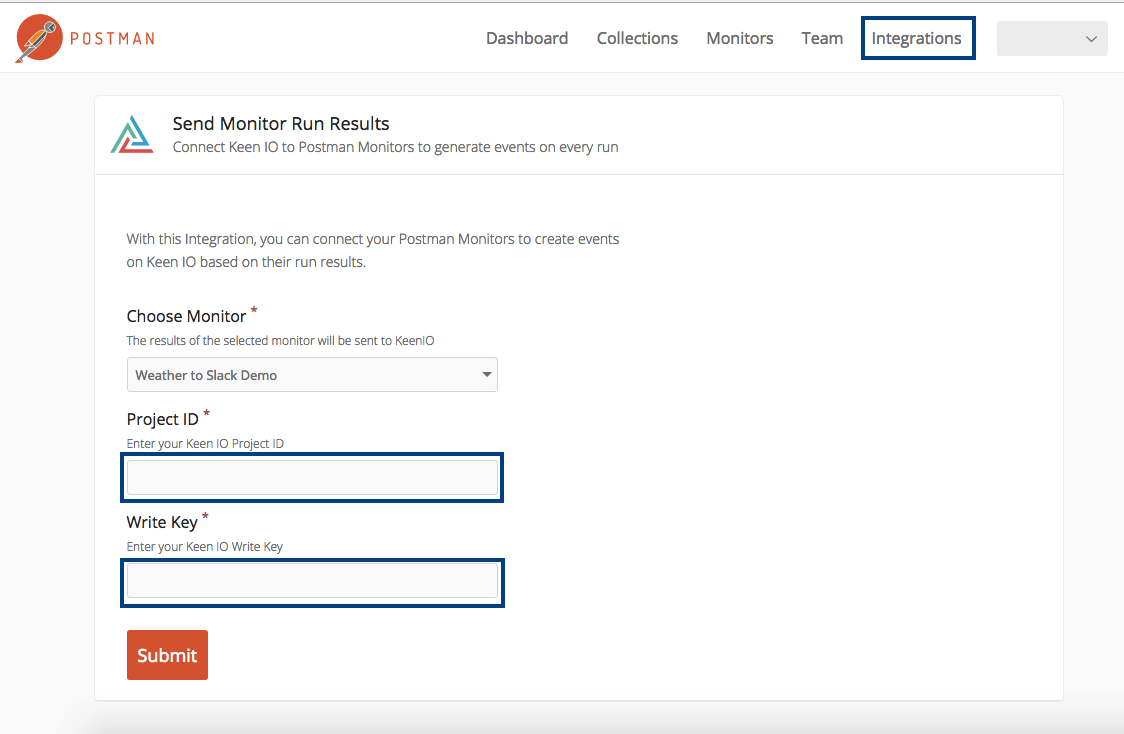
Press “Submit”.
Note: You can send the results of multiple Monitors to the same Keen collection.
You’re all done! Provided your Monitor is running, you should start to see data flowing into Keen in a few minutes.
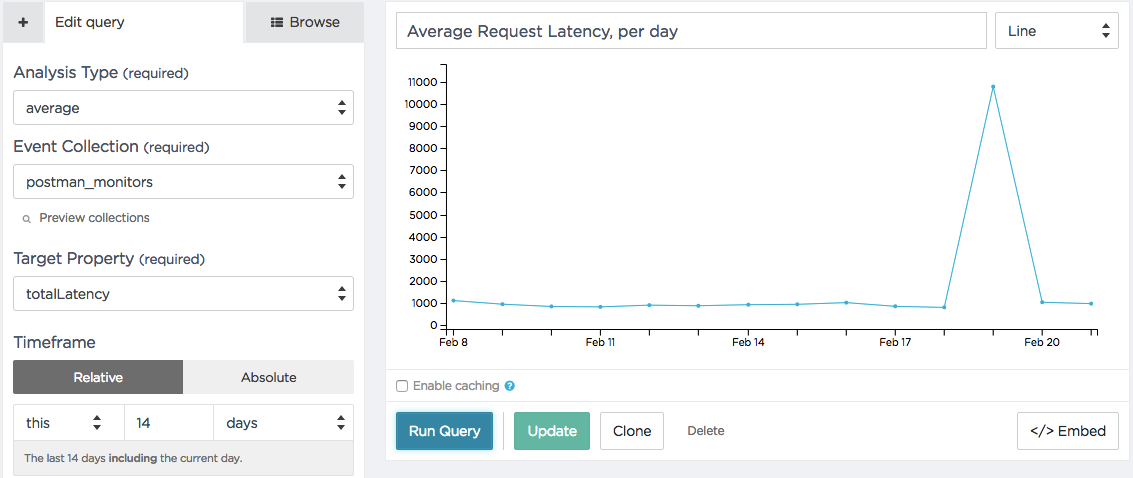
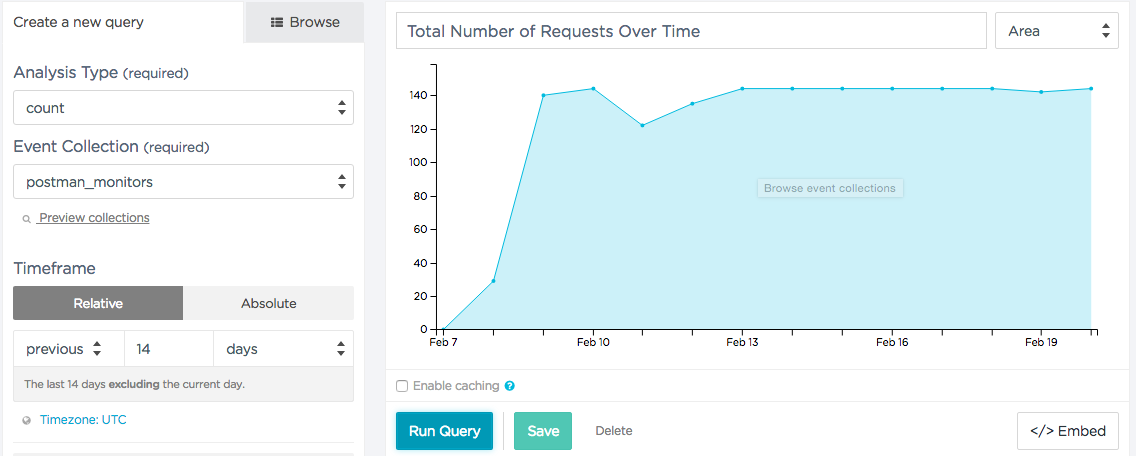
How your data appears in Keen
Once data arrives in Keen, it will be ready to Explore. If you’ve sent the results of multiple Postman Monitors to Keen, you’ll be able to segment by monitor name/id, collection name/id, error code, etc.
Here’s a preview of analyses we built from the Postman Monitors integration.
Building Visualizations & Dashboards
You can build the visualizations that you’ve seen here into dashboards your team or customers can view, by utilizing our dashboard templates: here.
