-
 Streams
-
Compute
- Overview
- Group By Ranges & Buckets
- Data Explorer Guide
- Video Completion Funnel
- Saved Queries
- Compute Pricing Guide
- Custom Ad Performance
- Session Timing Metrics
- Cohort Analysis
- Retention Analysis
- Funnel Analysis
- Creating a Funnel with an OR Condition
- Stripe Revenue Queries
- Create a Email Nightly Report
- Query Tuning
- Cached Queries
- Cached Datasets
- Paid Session Metrics
- User Engagement
-
Visualize
Customer-Facing Analytics
Keen’s very powerful analytics platform empowers you to track whatever data you care about, from anywhere, and then analyze and present valuable results in any environment. This flexibility makes it very easy to build customer-facing analytics for your users. This guide will show you how to build customer-facing analytics into your product with Keen!
This guide will cover:
- Getting the right customer-facing data model
- Data Analysis and Query Caching
- Security features and Access Keys
- Displaying visualizations to your users
Data Modeling
The first thing you need to nail down is the data model. Conveniently, most data models already work really well for customer-facing analytics.
Set a user id property for every event
For instance, let’s pretend that you sell internet-connected fitness watches, and you want to show a user their fitness stats. Whenever someone buys one of your watches, you assign a customer ID to that watch. That customer ID is also probably stored in the database that serves your website. Your fitness watch tracks every step that its owner takes, and stores that event in Keen.
Whenever you track a step, you want to make sure to include that customer ID property. Later on, when we’re ready to start analyzing data, we will use the customer ID to pull data for each specific customer. Your data model for each event sent might look something like this:
{
  location: {
    latitude: 37.773972,
    longitude: -122.431297
  },
  velocity: {
    speed: 6.32, # meters per second
    direction: 43.25 # degrees from north
  },
  customer_id: 1872
}
Data Analysis
Ask questions and return answers with the Query API
The Query API enables you to ask any question you want. Let’s say we want to show our watch customers what their average running speed is. This is an easy query, using Keen’s average API and a filter for the customer ID.
Here’s an example of how to run a query with keen-analysis:
The important part of that query is the filters section. I’m doing a filter to make sure that I only average over data where customer_id is equal to the current user’s customer_id. On your customers' dashboard, you will want to set that filter dynamically using a variable from your server.
Security
Access keys allow you to create separate API keys for each of your individual users. You can apply filters to an Access Key, so that all queries done with that key will have a filter applied. This allows you to create customer-specific keys that automatically add the customer filter.
This examples shows how an Access Key is created using CURL.
$ curl https://api.keen.io/3.0/projects/PROJECT_ID/keys
  -H "Authorization: MASTER_KEY" \
  -H "Content-Type: application/json"
  -d '{
        "name": "My Customer XYZ's Key",
        "is_active": true,
        "permitted": ["queries", "cached_queries"],
        "options": {
          "queries": {
            "filters": [
              {
                "property_name": "customer.id",
                "operator": "eq",
                "property_value": "xyz"
              }
            ]
          },
          "cached_queries": {
            "allowed": ["my_cached_query"]
          }
        }
      }
Once you’ve generated this key, Keen will store it for you so it can be reused in the future. You can request a list of all Access Keys via the API or view a table which can be edited and managed under Settings. After creating your customer-specific access key, you can inject the access key into your customer-facing visualizations, instead of using your regular API keys. This will automatically add the customer filter, so you don’t have to anymore.
Here’s an example of what our users average speed query will look like when we use the access key:
Data Visualization
Now that you have all of the pieces to efficiently collect and analyze user metrics it’s time to visualize them in your product! We have a few resources that you can use to build in-product visualizations for your customers:
These visualizations tools work directly with the Keen Query API, making building visualizations a breeze!
Here’s an example of the customized Keen dashboard that presents Smart Home analytics.
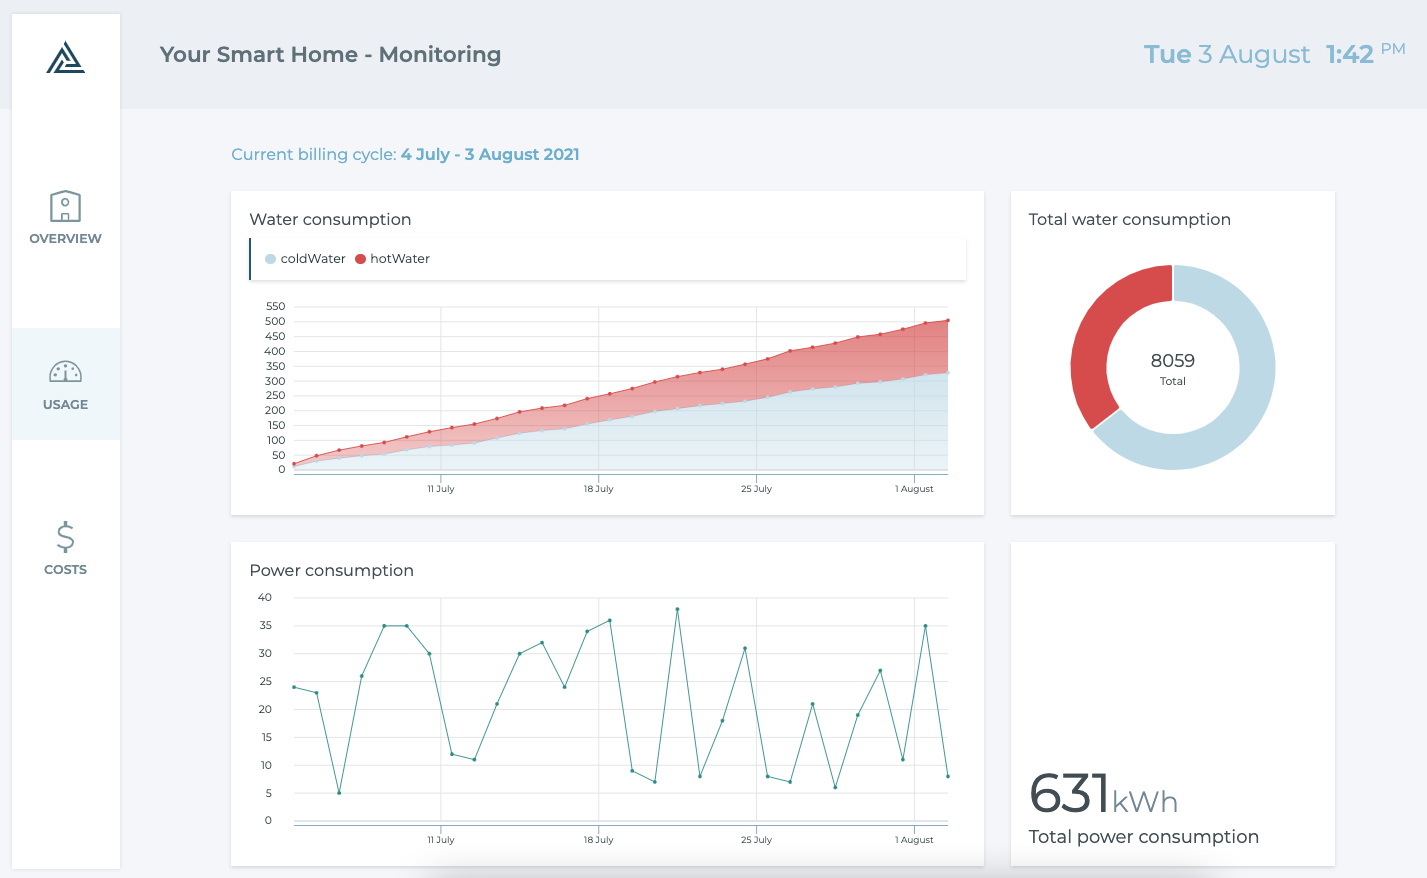
That’s it! These changes were done entirely in CSS, and took less than 5 minutes!
Visual learner? Check out our Customer-Facing Analytics video tutorial!
If you have questions about building customer-facing analytics, reach out to us or ping us on Slack! Our team of data engineers are ready to help.
