-
 Streams
-
Compute
- Overview
- Group By Ranges & Buckets
- Data Explorer Guide
- Video Completion Funnel
- Saved Queries
- Compute Pricing Guide
- Custom Ad Performance
- Session Timing Metrics
- Cohort Analysis
- Retention Analysis
- Funnel Analysis
- Creating a Funnel with an OR Condition
- Stripe Revenue Queries
- Create a Email Nightly Report
- Query Tuning
- Cached Queries
- Cached Datasets
- Paid Session Metrics
- User Engagement
-
Visualize
GitHub Analytics
Store, Analyze, Visualize, & Report on GitHub Activity
Track GitHub Data with Keen
Track and analyze GitHub repo activity via webhook integration. Quantify and visualize the success of your project and record everything from pushes, pull requests, comments, project creation, team member additions, and wiki updates. (219 characters)
We believe an important aspect of creating healthy, sustainable projects is having good visibility into how well the people behind them are collaborating. At Keen, we’re pretty good at capturing JSON data from webhooks and making it useful, which is exactly what we’ve done with GitHub’s event stream. By allowing you to track and analyze GitHub data, we’ve made it easy for open source maintainers, community managers, and developers to view and discover more information to quantify the success of their projects. This integration records everything from pushes, pull requests, and comments, to administrative events like project creation, team member additions, and wiki updates.
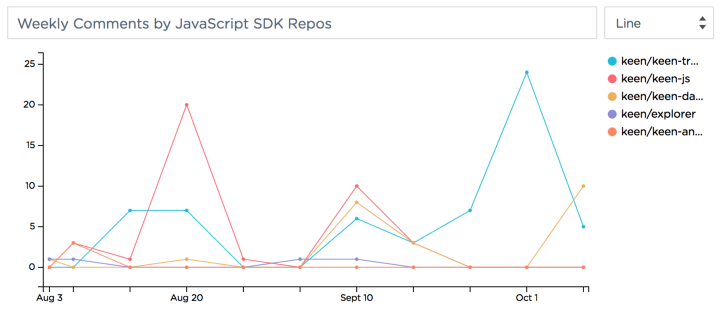
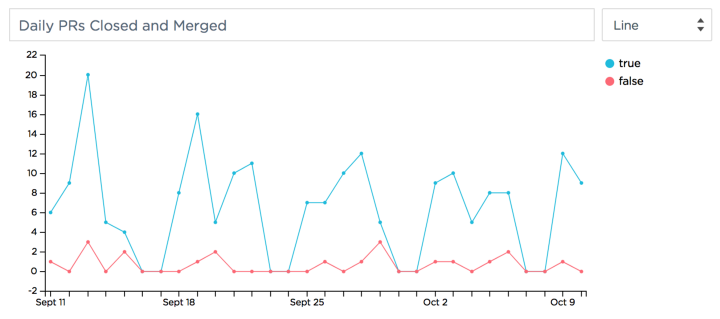
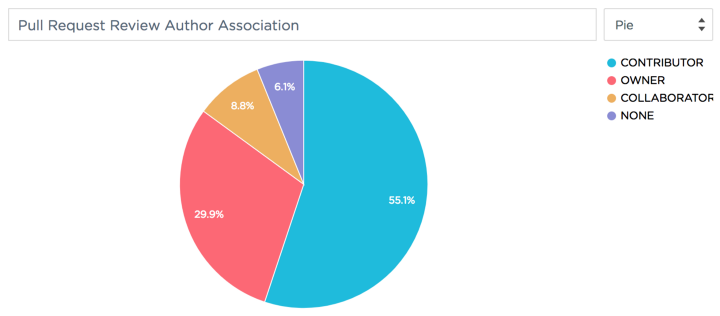
Once the integration is setup, you can use Keen’s visualization tools like the Explorer, Dashboards, and Compute API to dig into granular workflow metrics, like:
- Total number of first-time vs. repeat contributors over time
- Average comments per issue or commits per pull request, with the ability to segment by repo
- Pull request additions or deletions across all repositories, with the ability to segment by contributor
- Total number of pull requests that are actually merged into a given branch
Ready to try it out?
Assigning webhooks for each of these event types can be a tedious process, so we created a simple script to handle this setup work for you.
Check out the setup instructions here on GitHub. With four steps, you will be set up and ready to rock in no time.
