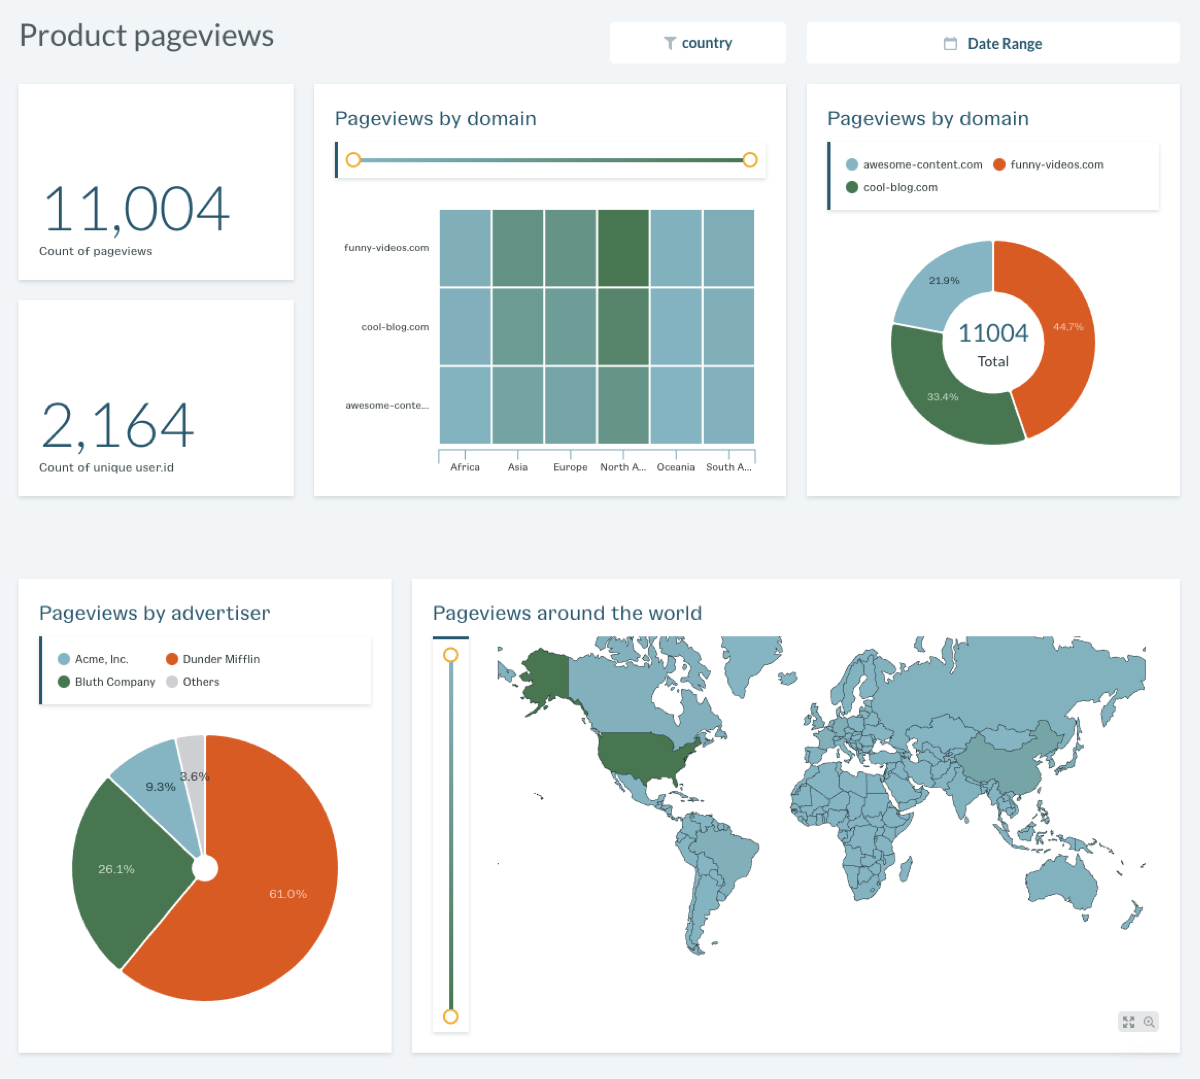
Build, customize, and seamlessly embed customer-facing analytics in your sites and applications with an intuitive data visualization API.
Use Keen to quickly build embeddable charts and dashboards within seconds of sending your data. Out-of-the-box visualizations include area charts, line charts, bar charts, pie charts, donut charts, metric charts, funnels, heatmaps, choropleths, and tables.
Looking for a no-code option?
You can create custom dashboards in the UI with our drag-and-drop Dashboard Creator. Then, seamlessly share them with your colleagues and external stakeholders by grabbing a shareable link.
Are you a developer?
Use our Data Visualization Library built with React and D3 to embed custom metrics in your website or application in minutes, not months. Or, embed an interactive dashboard created in the UI by using an HTML snippet.

