-
Streams
-
Compute
- Overview
- Group By Ranges & Buckets
- Data Explorer Guide
- Video Completion Funnel
- Saved Queries
- Compute Pricing Guide
- Custom Ad Performance
- Session Timing Metrics
- Cohort Analysis
- Retention Analysis
- Funnel Analysis
- Creating a Funnel with an OR Condition
- Stripe Revenue Queries
- Create a Email Nightly Report
- Query Tuning
- Cached Queries
- Cached Datasets
- Paid Session Metrics
- User Engagement
-
Visualize
Retention Analysis
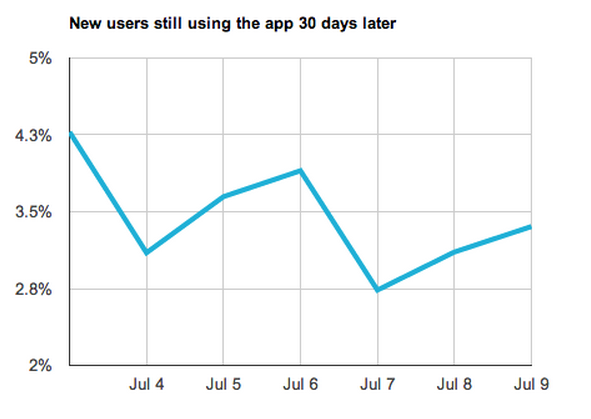
You can use Keen to figure out if people like your app and keep using it over time. Retention analysis works by determining how many entities that do an activity in a given week do an activity in subsequent weeks. For example, retention analysis can help you answer questions like:
- What percentage of your new users from last week came back and used your app this week?
- What’s your retention rate at 5 weeks? 15 weeks?
For more info on how retention analysis works, checkout the blog post How to Do a Retention Analysis.
Below are a few example methods for analyzing retention:
Retention Analysis in Ruby
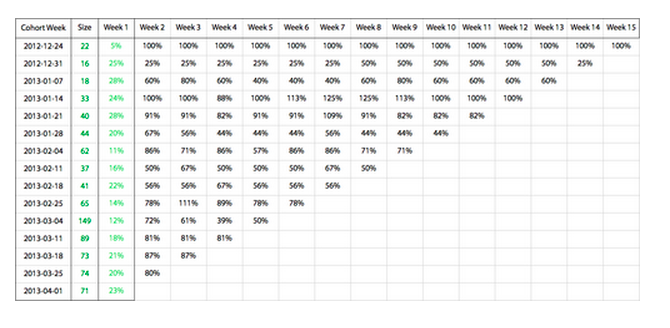
Here’s a ruby script that generates a week over week retention analysis like this:


Note: If you’re still on the old version, V2, of the Keen JavaScript library, use this recipe.
