Hold on to your data, because we have a major release coming your way! We’re extremely excited to introduce Dashboard Creator from Keen.
Note: This is our beta version, so play around and let us know what you think. Any feedback is welcome! You can share your thoughts here.
What is Dashboard Creator?
Dashboard Creator is a user-friendly data visualization tool that seamlessly integrates with our existing libraries (keen-analysis.js and keen-dataviz.js). With easy-to-use drag and drop features, users can create dashboards of various charts, and even share them with external clients. We’ve also integrated the old dashboard builder version with the new one, so customers can use new functions on already existing dashboards. Not to worry, your streams will transfer from Dashboard Classic to Dashboard v2 Beta so you can continue business as usual.
Why did we develop Dashboard Creator?
Our Dashboard Creator was developed to improve the way dashboards in keen.io are created. Currently, the old creator only uses rows and does not provide much freedom in the way you can format your dashboards. With our new Dashboard Creator, we’ve introduced customized dashboards that, in future versions, can even be shared outside the platform with the click of a button. This makes sharing your data with others easier than ever before!
Dashboard Creator uses:
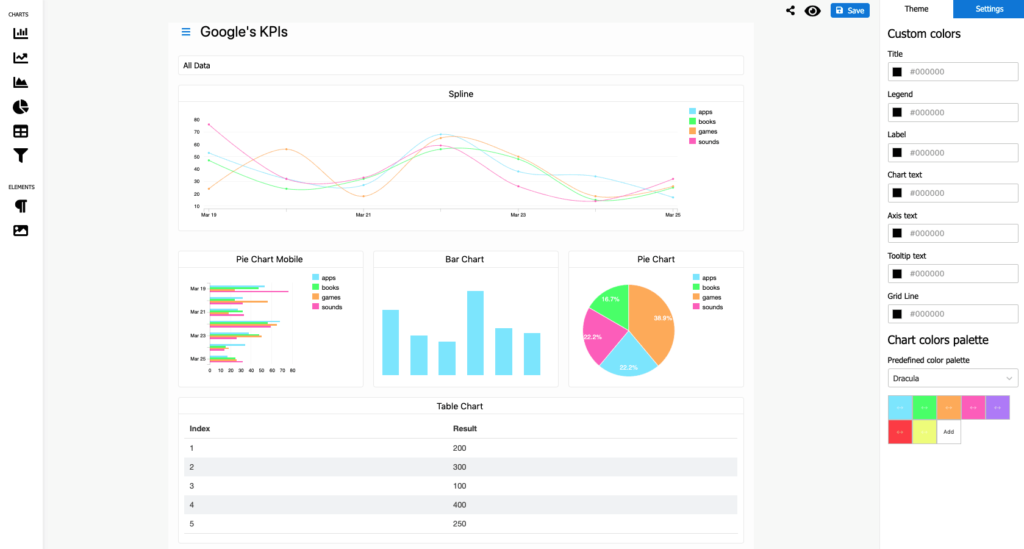
The possibilities are endless! Simply by dragging and dropping, users can:
- place multiple charts in any order or array of their choosing,
- select a specific saved query for each chart,
- reorganize chart displays with a click of a mouse,
- resize, clone, delete and change settings easily.
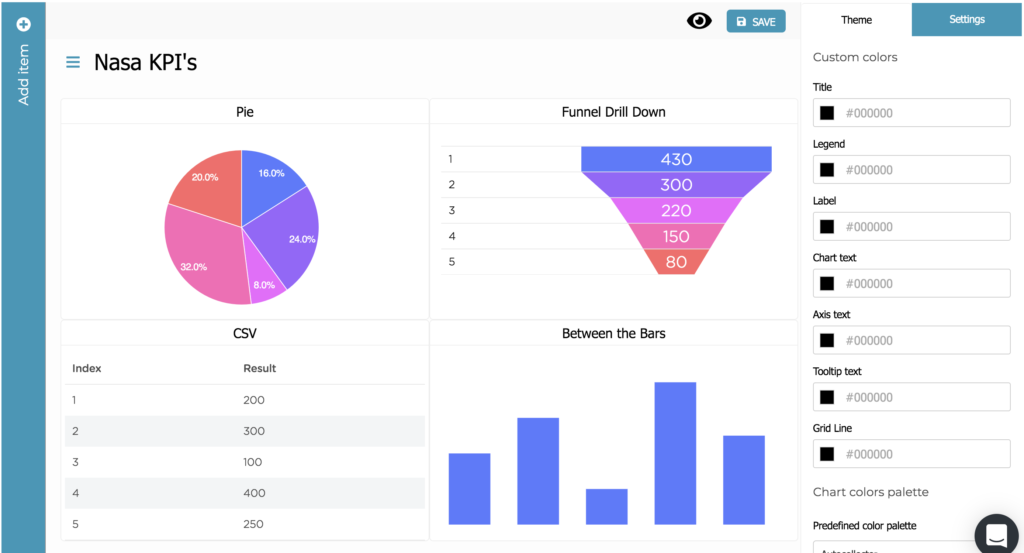
Alongside these charts, we’ve also created the option to place text and image elements. In editor, to prevent running unnecessary queries (and to save you hard-earned dollars) you can enable our “dry run” option. By choosing this option, the charts will display “dummy data”, without running a query when the website is refreshed or something is changed.
In the top bar, next to the save button is an icon to see read-only versions of created dashboards in preview mode. In future versions when using this feature, you can share links to specific dashboards with clients. This will allow clients to view the shared dashboards without having to log into keen.io. On the right column, users will have access to our other newly-featured rollout, Theme Builder which allows users to easily change the look of a chart’s elements.
What makes Dashboard Creator different?
Similar to our Theme Builder, Dashboard creator is integrated with our already existing libraries to fetch data (keen-analysis.js) and display them(keen-dataviz.js), making it simple and easy to create and manage all of your dashboards and data in one central location.
What’s to come?
In future versions, you’ll be able to share these dashboards with users outside of your organization, export the entire dashboard into a snippet of code, and much more. Stay tuned for more information!
Think Keen may be the right fit for your data needs? Schedule a demo with us today.
Blog posted updated 2/12/2020


