Hey Keensters!
Ever wanted to customize your Keen Dataviz charts with your company or client’s design palette? Now you can! Introducing the new Theme Builder from Keen.
What is Theme Builder?
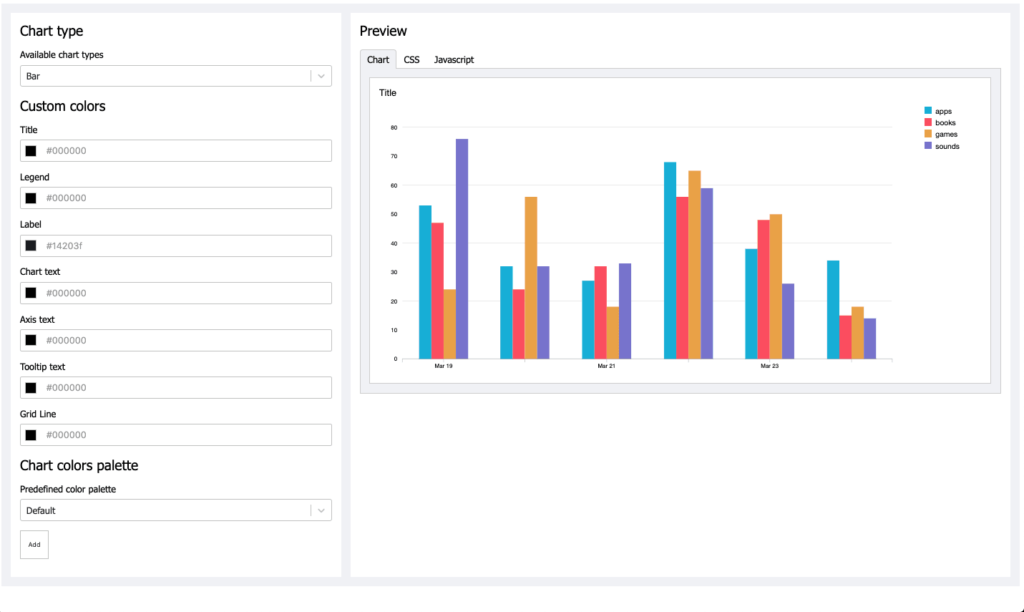
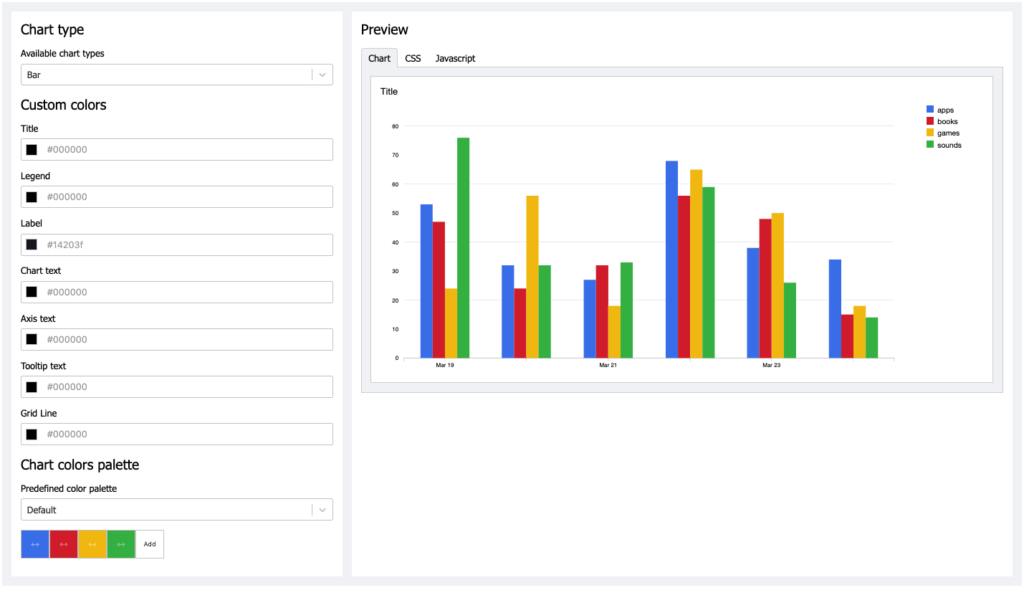
Theme Builder is a tool that allows users to generate color themes for Keen Dataviz charts without coding. There are two sections – configuration and preview. Users can configure colors for different chart elements on the left side of the screen, while simultaneously viewing the live preview on the right. In addition to viewing chart previews, Theme Builder generates CSS and JS code samples ready to use with Keen Dataviz. Easy-peasy.
Why did we develop the Theme Builder?
Theme Builder was developed to be able to quickly implement color themes for Dataviz charts and immediately see them in action. It’s a point-and-click user-interface, pretty neat, huh?
Now you can visualize and present data to clients and/or stakeholders that is customized to your specific brand, creating cohesiveness across all of your platforms.
Ways you can use Theme Builder
We also designed Theme Builder to be versatile. This new feature can be used as a standalone application or as a part of your larger-scaled efforts.
Standalone Application
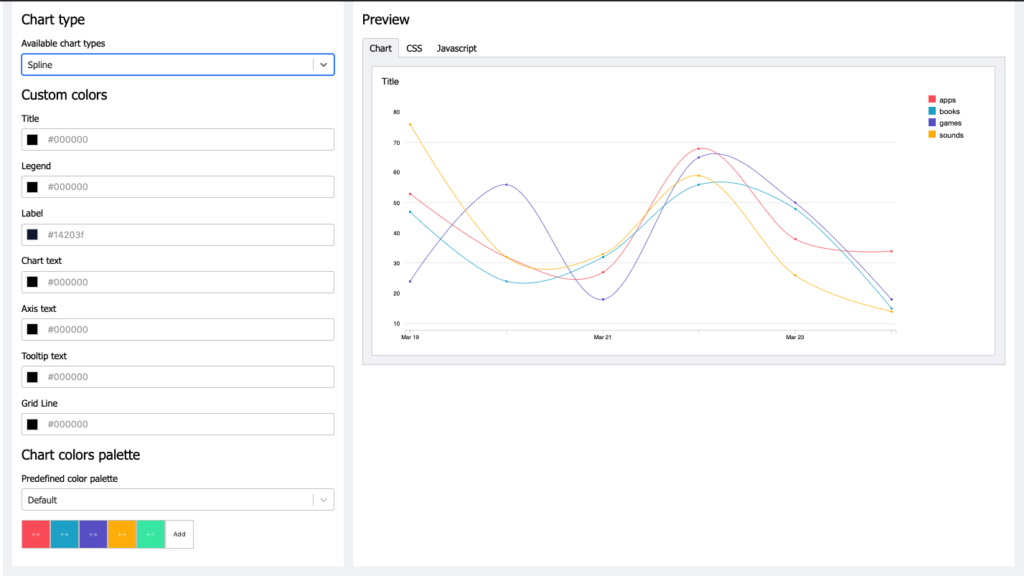
You can select different chart types to preview from the left and specify color samples for titles, labels, tooltips, etc. Equally important, you can choose a preset color palette for the chart data, or input your own specific HEX or RGB color codes. The possibilities are endless! These changes are applied immediately to the preview section on the right. By browsing the tabs atop the chart preview section, you can easily retrieve code samples in CSS and JS required for Keen Dataviz.
Large-scaled Efforts
Theme Builder can be used as a part of a larger app as well. (For example, Theme Builder is a part of the upcoming new release, Dashboard Builder). When scaled, its operating principles are the same. One difference to note – the preview section is not visible from other apps, meaning users will have to apply data returned from Theme Builder to their own charts. Every change of color will result in an onChange callback that returns data from Theme Builder.
Though there are similar products on the market that allows users to create custom themes, Theme Builder is especially suited to Keen Dataviz, making it a one-stop-shop for you and your data. In all, this tool allows you to create customized color themes for Dataviz charts – without writing a single line of code.
Feeling like Keen may be the right fit for your data needs? Schedule a demo with us today.
Happy visualizing!


