Restless and still awake after a hard day’s commitments, do you ask yourself questions like these?
- Is my site getting faster over time? Or slower?
- What is wrong with that new App Server in Dallas?
- Will those new SSDs improve response times for mobile clients in the UK?
Posing these questions, and tracking down the answers, is an important part of building and operating a WebScale™ HTTP service. And this job only gets harder as your service grows up.
Do not despair. Today Keen IO is happy to announce Pingpong — an open source, clone-and-deploy application for doing HTTP analytics. It’ll help you answer those questions, and more importantly, it will help you sleep better.
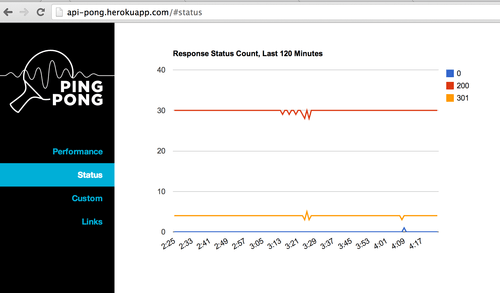
Pingpong makes HTTP requests to URLs you configure, as frequently as once per second. Pingpong turns data about each request and response into JSON then logs it to a configurable destination — Keen IO by default.
Pingpong uses that data to create a dashboard that shows latency and uptime metrics. Adding new visualizations and new properties to analyze later on is easy.
Let’s Play!
You can deploy a Pingpong instance in 5 minutes. Just add URLs to a JSON file, deploy, and start learning. The Github README has everything you need to know, including some recipes for when things get interesting.
I’ve been known to make a programming pun or 10, but Pingpong is all business. There’s no class named ‘Swing’ nor method named ‘serve’, and any reference to ‘The Net’ refers strictly to Net::HTTP.
So if you see find any funny business while you’re poking around in there, please file an issue. Pull requests and issues for bugs and new features are very welcome. We want Pingpong to have a very pro-community feel, because it actually is very pro-community.
In fact I’d like to take the rest of this post to talk about why we’re so excited to collaborate with you on projects like Pingpong.
Let’s get philosophical.
The Last Mile of Analytics
As the cost of storage, network, and CPU decreases, the burden of getting meaningful information about the world shifts from a systems problem to a human problem. Shipping data from Point A to Point B, while certainly not trivial, isn’t the highest hurdle anymore. Thanks Internet!
The hard part now is figuring out what needs to go from A to B, and what you need back from B so you can make your decisions. The former exercise is known as Data Modeling, and the latter could be called Query Planning. This is the last mile of analytics, and we all must walk its capricious path.
Abstraction-as-a-Service
Acronym intentionally omitted.
As API builders, we at Keen IO aim to abstract away everything we can for you. To be a mirror, clean and smooth, that reflects the beauty of your new app’s viral growth right back at ya. That’s us at our best. You get a beautiful (at least, accurate) picture of yourself, and we worry about all the delicate light-bending equipment (aka computers).
Given our love of abstraction, wouldn’t we love to abstract away all that data modeling and query planning for you too? Drop you right into the victory lap? Well of course we would! We love Love LOVE abstraction. So here’s the big announcement–
We Did It! The Future is Now Here Today. To auto-generate your startup’s data model, just put on these jailbroken Google Glasses and don’t blink until the light turns off or we will have to start over.
Kidding! We can’t extract your thoughts and use them to reverse-engineer your data model. Even with Glass. Even with Peter and he has a Cognitive Science degree.
That’s still Science Fiction and we live in a primarily Science Nonfiction world. But the thoughts are yours anyway. You should keep them. There’s good stuff in there!
You — as the developer, the designer, the business owner, the product manager, the adventurer, you know the most about your app or your mobile game or your market. Consequently, you know best what the important questions are, and what data you’ll need to answer them. You know where the last mile starts, and where it must lead. There’s no shortcut, and please no hitchhiking.
Analytics Mechanics
All we, Keen IO, can do is help. We’re the mechanic and analytics is the bike. Only you, the rider, know where you want it to take you. But you don’t have to go alone.
The friendly data mechanics at Keen IO will guide you towards which make and model is best for which type of terrain, and show you what to tighten and what to loosen along the way. And sure, we’re happy to sketch you a map on a napkin — but we can only do that if we’ve ridden through that part of town before.
I’ll be honest — a lot of our customers are journeying into new, unexplored territories, I mean really innovative stuff, and we love them for it. It pushes us. We want you to succeed, and we want to be successful with you.
On the other hand, occasionally in life you are made to run a data errand, and doing the same thing over and over again is exhausting. It’s reinventing the wheel, not using the wheel to reinvent something else.
We ran into one of these laborious situations not too long ago: anomaly detection in a group of HTTP servers. Many of us have dealt with this before, but for some reason it’s never an open-and-shut case. There’s no express train that speeds you across that last mile right to your destination — the answer.
Inspiration behind Pingpong
Not uncommonly, we have some servers that run some HTTP services. Sometimes we want to reward the fastest one and give it hugs and candy and then find the slowest one and take it to coffee to see if it’s just having a hard time finding a decent apartment or making time for its OS or whatever. It’s ok to ask. It wants you to ask.
There are a lot of Server Psychology tools that do their jobs pretty darn well. But ultimately, we booked ourselves for this particular gig.
One reason is because the questions we wanted to pose turned out to be multi-dimensional, and the dimensions can change each time you learn something new. Here’s a question we wanted to ask:
For clients in Ireland to servers in Dallas that are a) running a custom build of nginx so fast that its creator Sam will tattoo it on his left arm once he turns 18 and b) are only serving writes, what does using SSL add to response times?
Like Sam’s hypothetical custom-nginx tattoo, it’s not easy to understand unless you have all of the context.
To run experiments like these we need to capture each property of the request and response and then do multi-dimensional analysis across time buckets. That’s not the sweet spot of traditional web monitoring products, but it is the sweet spot of Keen IO.
Working Together
Since its internal launch, Pingpong has issued over 20 million HTTP requests to our infrastructure, and helped us nail down network issues, isolate infrastructure problems, and experiment with different configurations. We’re open sourcing it so you can find your outliers too.
Pingpong is more than just the bicycle, it’s a set of maps and a flashlight. The data model is served up for you in a way that’s easy to extend, and the project as a whole is designed to be easy to contribute to.
Until the FDA approves the mind-meld, we can’t read your mind and we can’t auto-generate your treasure map to a billion-dollar market. But we can collaborate on projects like Pingpong, and others down the road, and pave many of the last miles of analytics together.


