On November 4th, 2013, Keen IO experienced a brief period of instability. In fact, it was three brief periods (lasting only minutes each) of instability over the course of about four hours. It started just before 12 PM Pacific time and was completely resolved a little before 4 PM Pacific time. This is a long time for a customer-facing incident; luckily, we were able to reduce the customer-impacting time periods to only a few minutes.
The core of our business is built on transparency and trust. I’m going to share a number of technical details here that will hopefully explain what went wrong and the steps we took to mitigate the immediate symptoms and the steps we took to fix the underlying issues now so this type of thing doesn’t happen again. This post is no excuse for the occurrence — we must and will do better in the future.
Prerequisites
Before proceeding, I should explain two things. Bear with me.
1.) When you’re a customer of Keen IO, you’re actually writing into / querying from multiple sources: our first architecture, backed by Mongo, and our second architecture, backed by Storm and Cassandra. The second is vastly more performant, and all of our biggest customers are on that. What that means is that all of their data is being written into Cassandra and all of their queries are processed by our Storm tier. However, we still write all data to Mongo.
The important distinction to make here is that the second architecture exposes a property on every event called “keen.id”. It’s what you’d expect — a collection-unique identifier for each event. The first architecture doesn’t expose this. While we certainly have internal ids we never added them to the data layer exposed to our customers.
2.) One of the features our customers love is the fact that our API is schema-less. You don’t have to set up tables or columns before sending us your data. Just shoot us some JSON and we’ll make sense of it. We call this “inferring schema”. Think of this happening asynchronously when writing events — we keep a count of the number of times we’ve seen a certain property, along with counts of what data type that property has had — string, number, etc.
What Happened
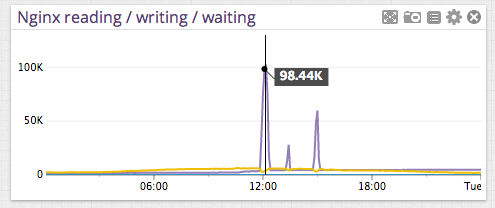
Right before noon, our monitoring started to alert us that something unusual was happening. We saw elevated numbers of exceptions (normally we see only a few a day and fix the underlying causes quickly). Charts related to our reverse proxy showed a HUGE spike in nginx writing connections (going from about 2,000 across all our load balancers to 100,000) that correlated to (smaller) dips in requests per second. The app servers in one of our data centers were completely loaded. API requests were still getting through to that DC, but very unreliably. Here are some screenshots of what we saw:
Nginx reading/writing/waiting connections (the spikes are pretty obvious):
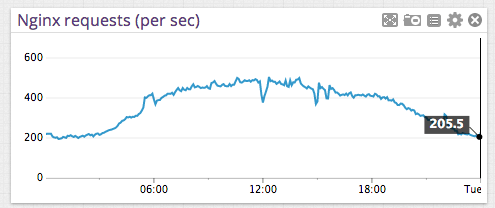
Nginx requests/second (look at the dips in RPS):
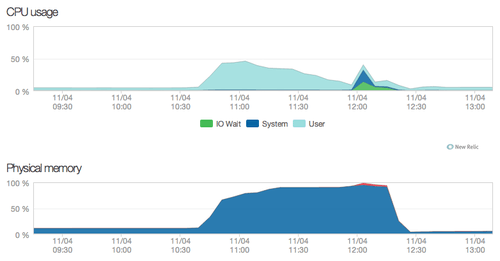
App server (the timeframe is different from the above charts but you can see the build-up, eventual 100% memory usage, and then steep drop-off as the Python processes were restarted):
The first thing we did was to attempt to relieve stress on the loaded app servers. We recently switched DNS providers to Dynect. It allows us to dynamically move traffic associated with specific geographic regions to different hosts very quickly. It also continually monitors the IPs we tell it to serve — if Dynect detects that any of those stop responding, it will cease serving those IPs via DNS. We immediately shifted traffic to our other DC — this almost immediately brought our connection load back to normal.
Unfortunately, the app servers in our first data center weren’t returning to normal load levels despite not serving much traffic. In an attempt to bring these boxes back in line, we do something we do all the time here — a normal code deploy. This effectively restarts the Python processes running our API servers, and does so in a user-safe way (i.e. we take servers out of the load balancing pool, update and restart them, then put the servers back in the pool). This successfully brought the load level back to normal. After monitoring for a few minutes we reverted the DNS changes we made to balance traffic evenly across our data centers again.
At this point, we had restored a normal level of service for our customers but hadn’t yet looked into what might have caused the problem to begin with.
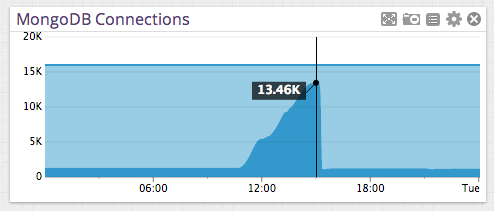
We quickly established that none of our service providers claimed to be having issues, so we started analyzing user behavior to see what we could pick up. We noticed two unusual things — a much higher level than normal of connections to one of our datastores (Mongo) combined with one specific customer firing off a number of API calls that we hadn’t seen before.
MongoDB connections (dark blue is open connections, light blue is available connections):
The customer use case was interesting. They had accidentally created some duplicated events in one of their bigger collections (over 5,000,000 events) and had written a script to clean those up. They knew what those duplicate events looked like, so their script did an API Extraction to pull all matching events. They then attempted to delete those matching events by ID.
For a customer on our Storm/Cassandra architecture, here’s what the lifecycle of a delete looks like:
- Delete request comes to an API server.
- We tell Storm to process that delete on Cassandra. Schema inference is taken care of automatically.
- We tell Mongo to process that delete, which happens in several phases:
- We build a Mongo filter based on the user request. This translates user-facing property names into their internal representations.
- A delete request is sent off to Mongo based on those filters.
- Once the delete finishes, we recalculate schema from the remaining events in the collection.
We hit two main problems with this approach:
1.) The Mongo architecture never expected a user to filter with a property called “keen.id”. Because we didn’t build a filter that would result in a query hitting an index, Mongo would revert to a full table scan, which is incredibly expensive. Even worse, the operation was a delete, which meant Mongo took out a write lock on the database for the operation, which meant that repeated deletes would stack up behind each other. For a small collection, this might be okay, but not for one that had over five million events. This explained the huge increase in open connections to Mongo.
2.) Recalculating schema is INCREDIBLY CPU and memory expensive. It requires pulling events from Mongo into app server memory, processing those events, and then issuing atomic counter increments back to Mongo. Again, this works okay if the collection size is small, but not if it’s big. The real eye opener here was that we used to protect against recalculating schema for big collections by prohibiting any delete operations on them. But then we added a feature that allowed users to delete small subsets of big collections (exactly what this customer was using) but neglected to account for what would happen when schema recalculations were fired off. This explained the huge increase in load to our app servers.
How We Fixed It
Here’s what we’ve done:
1.) Made it so that queries or deletes that filter on “keen.id”, even against mongo, will drive against the internal ID field. This means these operations are MUCH faster since they’ll use the index on ID.
2.) Changed our schema recalculation logic. Basically, we don’t recalculate for very large collections. In hindsight, we believe the recalculation was overkill and customers weren’t getting any benefit from it anyways.
3.) Changed certain alerting thresholds. For example, our monitoring tool wouldn’t alert us until app servers were above 90% memory usage for a prolonged period. We lowered this to 50%. Same for CPU on the app servers. On nginx and Mongo, we’re triggering alerts on much lower activity levels than we saw yesterday. We believe this will give us more time to diagnose and fix problems BEFORE they become customer impacting.
All this was done by about 4 PM Pacific time on November 4th.
What’s Next
One of the changes we made in the last few months was to separate our Python API processes into two pools:
- A pool that handles receiving incoming events and writing them.
- A pool that handles queries.
This was done to increase reliability for writes. This has been successful and I think a positive change for our customers. Unfortunately, the pool splitting didn’t account for deletes. We do this pool splitting by matching on request path in nginx. The URLs for event insert and event delete are the same — they just use different HTTP methods. So deletes were going to the write pool.
The deletes described above effectively made our write pool in one DC unreliable. That’s unacceptable, so we’re going to make sure deletes are served by the queries pool. This work will happen over the next few days.
Summary
As always, we take any event that’s customer-impacting very seriously. While this incident was less serious than it might have been, it’s still unacceptable. Our obligation to our customers is to be completely transparent when problems do occur, and I’ve attempted to do that here.
If anything in this writeup is unclear or you simply have questions about this or Keen IO in general, please get in touch with me. Leave a comment below, e-mail me at dan@keen.io, or contact our whole team at team@keen.io. Thanks for reading.


