This is a guest post by Michael Bleigh, CEO/Cofounder of Divshot, the front-end application platform. At Intridea, he created Ruby open source libraries OmniAuth and Grape among many others. He also organizes the Web Components LA meetup group and the Static Showdown worldwide virtual hackathon.
What’s the point of building developer tools? For most, this is an academic question. For us at Divshot (and for the folks at Keen), it’s core to building our companies. My favorite developer tools all do something very specific: they prevent me from having to learn something.
That’s right. Forget “The More You Know.” Forget “Knowing is Half the Battle.” If you’re a developer (especially at a startup), any given week you might deal with a dozen different subjects upon which you could base an entire career. If those subjects aren’t completely core to your business, they’re damaging your ability to concentrate.
Enter developer startups. These companies exist so that you can basically do this:

But accomplish things more like this:

Because of Stripe, I don’t have to learn how to handle regulations-compliant credit card storage and transaction processing. Because of GitHub I don’t have to learn how to set up and manage version control systems for my team. At Divshot (shameless plug) we’re making it so you don’t have to learn how to deploy modern front-end code.
I’m adding things to my “didn’t have to learn” list all the time these days. There are few things more satisfying than realizing someone else has already done a great job of solving your problem. Which brings us to the tale of how our team saved weeks of effort by not learning how to build custom analytics.
Analytics is a lot to learn
All companies are sitting on a wealth of analytics data that could be tremendously useful to them or their customers. Being able to actually aggregate and present it in a useful fashion, however, requires an awful lot of work. And so the story went with our app usage data.
We had various system and account-wide monitors in place to measure bandwidth usage, etc., for our paid plan limits. But it was spread out across multiple systems (internal Redis instances, the MaxCDN Reports API, MongoDB, and so on) and only calibrated in a way that was useful to us as the administrators of the system.
We needed a place to aggregate our usage data, and we needed a way to expose that data to our users in a flexible way (i.e., fast arbitrary queries, not “reports” that take minutes to compile). As you might have guessed, Keen fit the bill perfectly. Keen allowed us to:
- Consolidate data from different places into a single united location and format.
- Run flexible analysis on that data, and fast.
- Easily expose the analytics to our users without having to play a middleman and store copies of the data on our own infrastructure.
In other words, instead of spending several weeks “learning” and cobbling together a semi-workable solution while doing this:
We were able to get data collection running with about a day’s work, and (once we had more than a month’s worth of data collected) we shipped it.
Technical Bits (OK, We Learned A Little)
At Divshot, we have both high-performance production environments that are served 100% from a CDN, and free development and staging environments that are served directly from the origin. MaxCDN (our CDN partner) provides hourly bandwidth and request reports via their API, but that only gave us part of the story.
Because our CDN’s report granularity is hourly, we wanted the same on our origin stack. If we tried to send an event for every request that came through our system, we’d quickly bankrupt the company with Keen bills, so we needed an ephemeral aggregation solution to roll up hourly stats, which would then be fed into Keen. Here’s how it works:
- On each request, our origin server makes note of the app’s ID, environment, and byte total.
- A Redis Hash keyed to the ID, origin, and start-of-the-hour timestamp has a byte total and request counter incremented appropriately.
- A scheduled worker sweeps through the keys, annotates the byte and request totals with account and app information, and publishes an event to Keen.
- A different scheduled worker creates a compatible data structure by querying the MaxCDN API for production request data.
The keen.timestamp property for each event is set to the start of the hour for which it was recorded, so when analyses are run on the data, everything pretty much just works!
Once data collection was sorted, we used Keen’s scoped keys to return keys that were filtered to a specific app. Those look something like this (in Ruby):
Keen::ScopedKey.new(ENV['KEEN_MASTER_KEY'], {
"filters" => [{
"property_name" => "app.id",
"operator" => "eq",
"property_value" => self.id.to_s
}],
"allowed_operations" => ["read"]
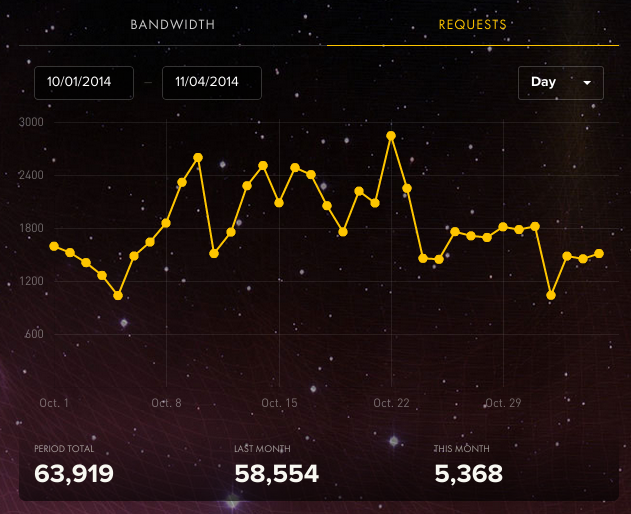
}).encrypt!The generated keys are then served up to our Angular-powered dashboard app via our JSON API. From there, it’s just a matter of using the JavaScript SDK to query for the appropriate data and Chart.js to draw the graphs. Voila!
Wrapping Up
Building software is a fractal of hard. Every piece you look at could consume you and your team for days, weeks, months, even years. That’s why, whenever you see an opportunity to offload a bit of hard on someone else, you take it!
Now that we’ve gotten a feel for Keen, we’re already thinking of other ways we can use it both for internal and customer-facing analytics. If Keen isn’t already a part of your standard stack, trust me, it will be soon.
What developer tools have prevented you from learning something new? I’d love to hear about them in the comments below.


