Hola. Michelle here. The past couple of weeks have been super exciting. We released a new version of our analytics API, a new UI, and we started rolling out hundreds of Keen IO accounts to our backlog of beta signups. I’ve been pretty obsessive about our internal metrics since I joined Keen IO, but I’ve never had a big burst of user activity to analyze like this. It’s like Data Christmas.
Not only do we have a lot more user activity, we just released a whole bunch of new API features. Now I have all these new toys to play with.
I never thought I’d be “playing with APIs”, but turns out programming is easier than I thought it would be. Ruby is a lot more fun than the C++ I learned in engineering school. Hours after everyone else in the house went to sleep last night, I was here in the office with 10 tabs open in Chrome. I was not facebook stalking or reading #binder tweets. I was learning how to sort hashes so I could make a list of our top 10 apps by event collection size.
What is the point of this blog post? Good question. Mostly I want to share some of the cool stuff I figured out how to do. I’m a new developer so I’m kinda proud of it. I also want to show people that analytics isn’t that hard. Lastly but most importantly, I want to showcase some of the new features we’ve released, because I’m even more proud of what our team has built. Our API docs are not too shabby (*pats self on back*), but they don’t do a great job showing how fun this stuff is to use.
Before I dig into the examples, I wanted to note that …
1) I started writing this a couple of days ago and it just kept getting longer and longer. Like over ten pages long. Apparently, I have a lot of things to tell the internet about analytics tools. I have decided to break the content into a series of more digestible parts. The series shall henceforth be known as “Michelle’s Analytics Showcase”.
2) We designed the Keen IO analytics platform for BIG data, like millions and millions of events per day streaming from devices all over the world. My examples here are not that impressive, but they do show you how you can get value out of the tools, even if you’re a new company like us with a small number of users.
3) While we have a culture of transparency here at Keen IO, that does not extend to sharing information about our users. We take that very seriously. I’ve obscured some of the user info in these examples.
Michelle’s Analytics Showcase
Part 1: Analyzing Logins
Let’s start with some of our simplest tools. Who is logging into Keen IO? We have some code in our web frontend that sends an event to Keen IO anytime one of you logs in. It records your account name, where you came from, and a few other pieces of information. We run a number of different queries on this data. Here are a few.
How many unique users have logged into Keen IO so far?
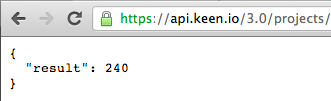
We want to know if people are clicking on our beta invite email and following through with making accounts. One way to measure that is to count the number of individuals who have successfully logged into our site. To calculate this I used the Keen IO “count_unique” feature and specified that results should be deduped based on the user’s email address.
Our REST API is pretty simple. Here’s what the query looks like:
https://api.keen.io/3.0/projects/<projID>/queries/count_unique?api_key=<key>&event_collection=login&target_property=user.email
A query like this can be pasted into a browser to get a result:
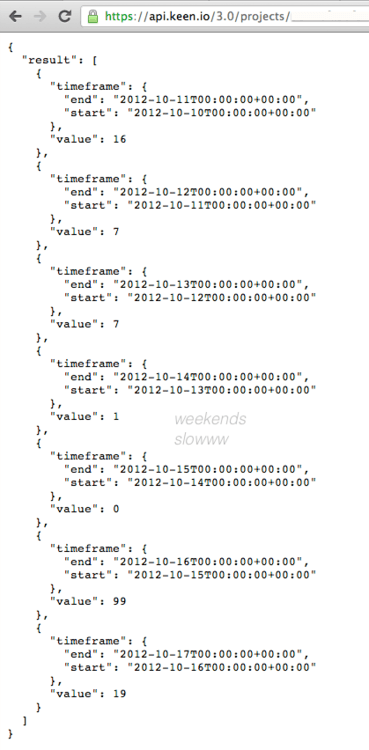
How many people logged in each of the past 7 days?
A series of data points can reveal patterns. Looking at the weekly login graphs of our early users, I noticed that people tend to use our site a lot more on Thursdays. I haven’t quite figured out what to do with this information, but it seems useful.
To get the counts for the week, I took the logins query I mentioned previously and added timeframe=last_7_days and interval=daily.
https://api.keen.io/3.0/projects/<projID>/queries/count_unique?&api_key=<key>&event_collection=login&target_property=user.email&timeframe=last_7_days&interval=daily
And here’s the result.:
Who logged in?
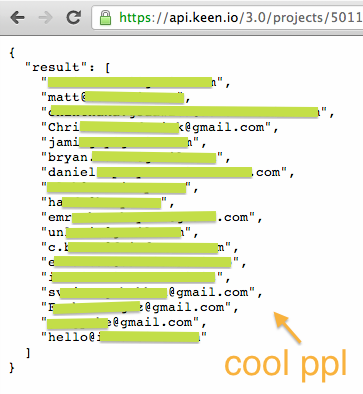
To kickoff our second wave of customer development, I needed to know which of our beta signups had accepted their invites and logged into Keen IO. I pulled the emails of everyone who has logged in the past week, and we’ve started sending them personal notes asking if they’d be willing to do a quick chat to provide their feedback.
Here’s the query I used to retrieve the emails of users who logged in today (it’s called a “select_unique” query):
https://api.keen.io/3.0/projects/<projID>/queries/select_unique?&api_key=<key>&event_collection=login&target_property=user.email&timeframe=today
The result is an array like this:
Who is on the site right now and do they need my help??
This is not something we built, but I wanted to share anyway. Ryan installed Olark last week and it’s quite impressive. It’s that little “contact us” tab you see at the bottom of Keen IO. It allows our visitors to initiate chats with us (click it!). Olark has Jabber integration, so visitors to our site automatically appear in my Adium contact list, with relevant info about them right there in the hover-text. So cool!! In the screenshot, you can see users on the site from Boulder, Oakland, and London.
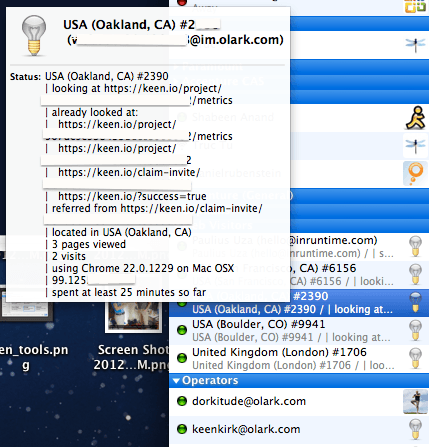
While I was writing this blog post, one of the visitors messaged me! I could see from the Olark metadata that he was in San Francisco. Turns out he works nearby. He had great feedback for our site, and thought we seemed like a cool team to get to know. We’re going to meetup for lunch on Tuesday. Thanks Olark!
====
Ok. So we didn’t really cover anything earth-shattering here. Just a simple event collection for logins and a few queries you could do on it. I promise there is good stuff to come. More advanced metrics, dashboard integration, performance testing, conversions… stay tuned.
– Michelle (@michellewetzler)
====
This post is Part 1 in Michelle’s Analytics Showcase. Here are some links to other posts in the series:


