The power in terms of the relationship between customer and business these days, is hands down, with the customer. They have more control and options, and their demands and expectations of the companies that they work with are higher than ever. While they understand the need for chatbots, helpdesk tickets, and scripts, they also want to feel that real people within companies care about their needs and are addressing them.
The key to evaluating a company’s level of customer success is through tracking customer analytics and delivering them in a way that is insightful and actionable to every department that has a touchpoint with the customer.
What should you be looking for in terms of customer service metrics and why? The truth is a company most likely already has plenty of customer data, but insights are hard to find. What they need is software that delivers customer-facing metrics that allows them to paint a picture of each customer’s satisfaction with the company, and also depicts customer health overall.
Who Are We Talking About?
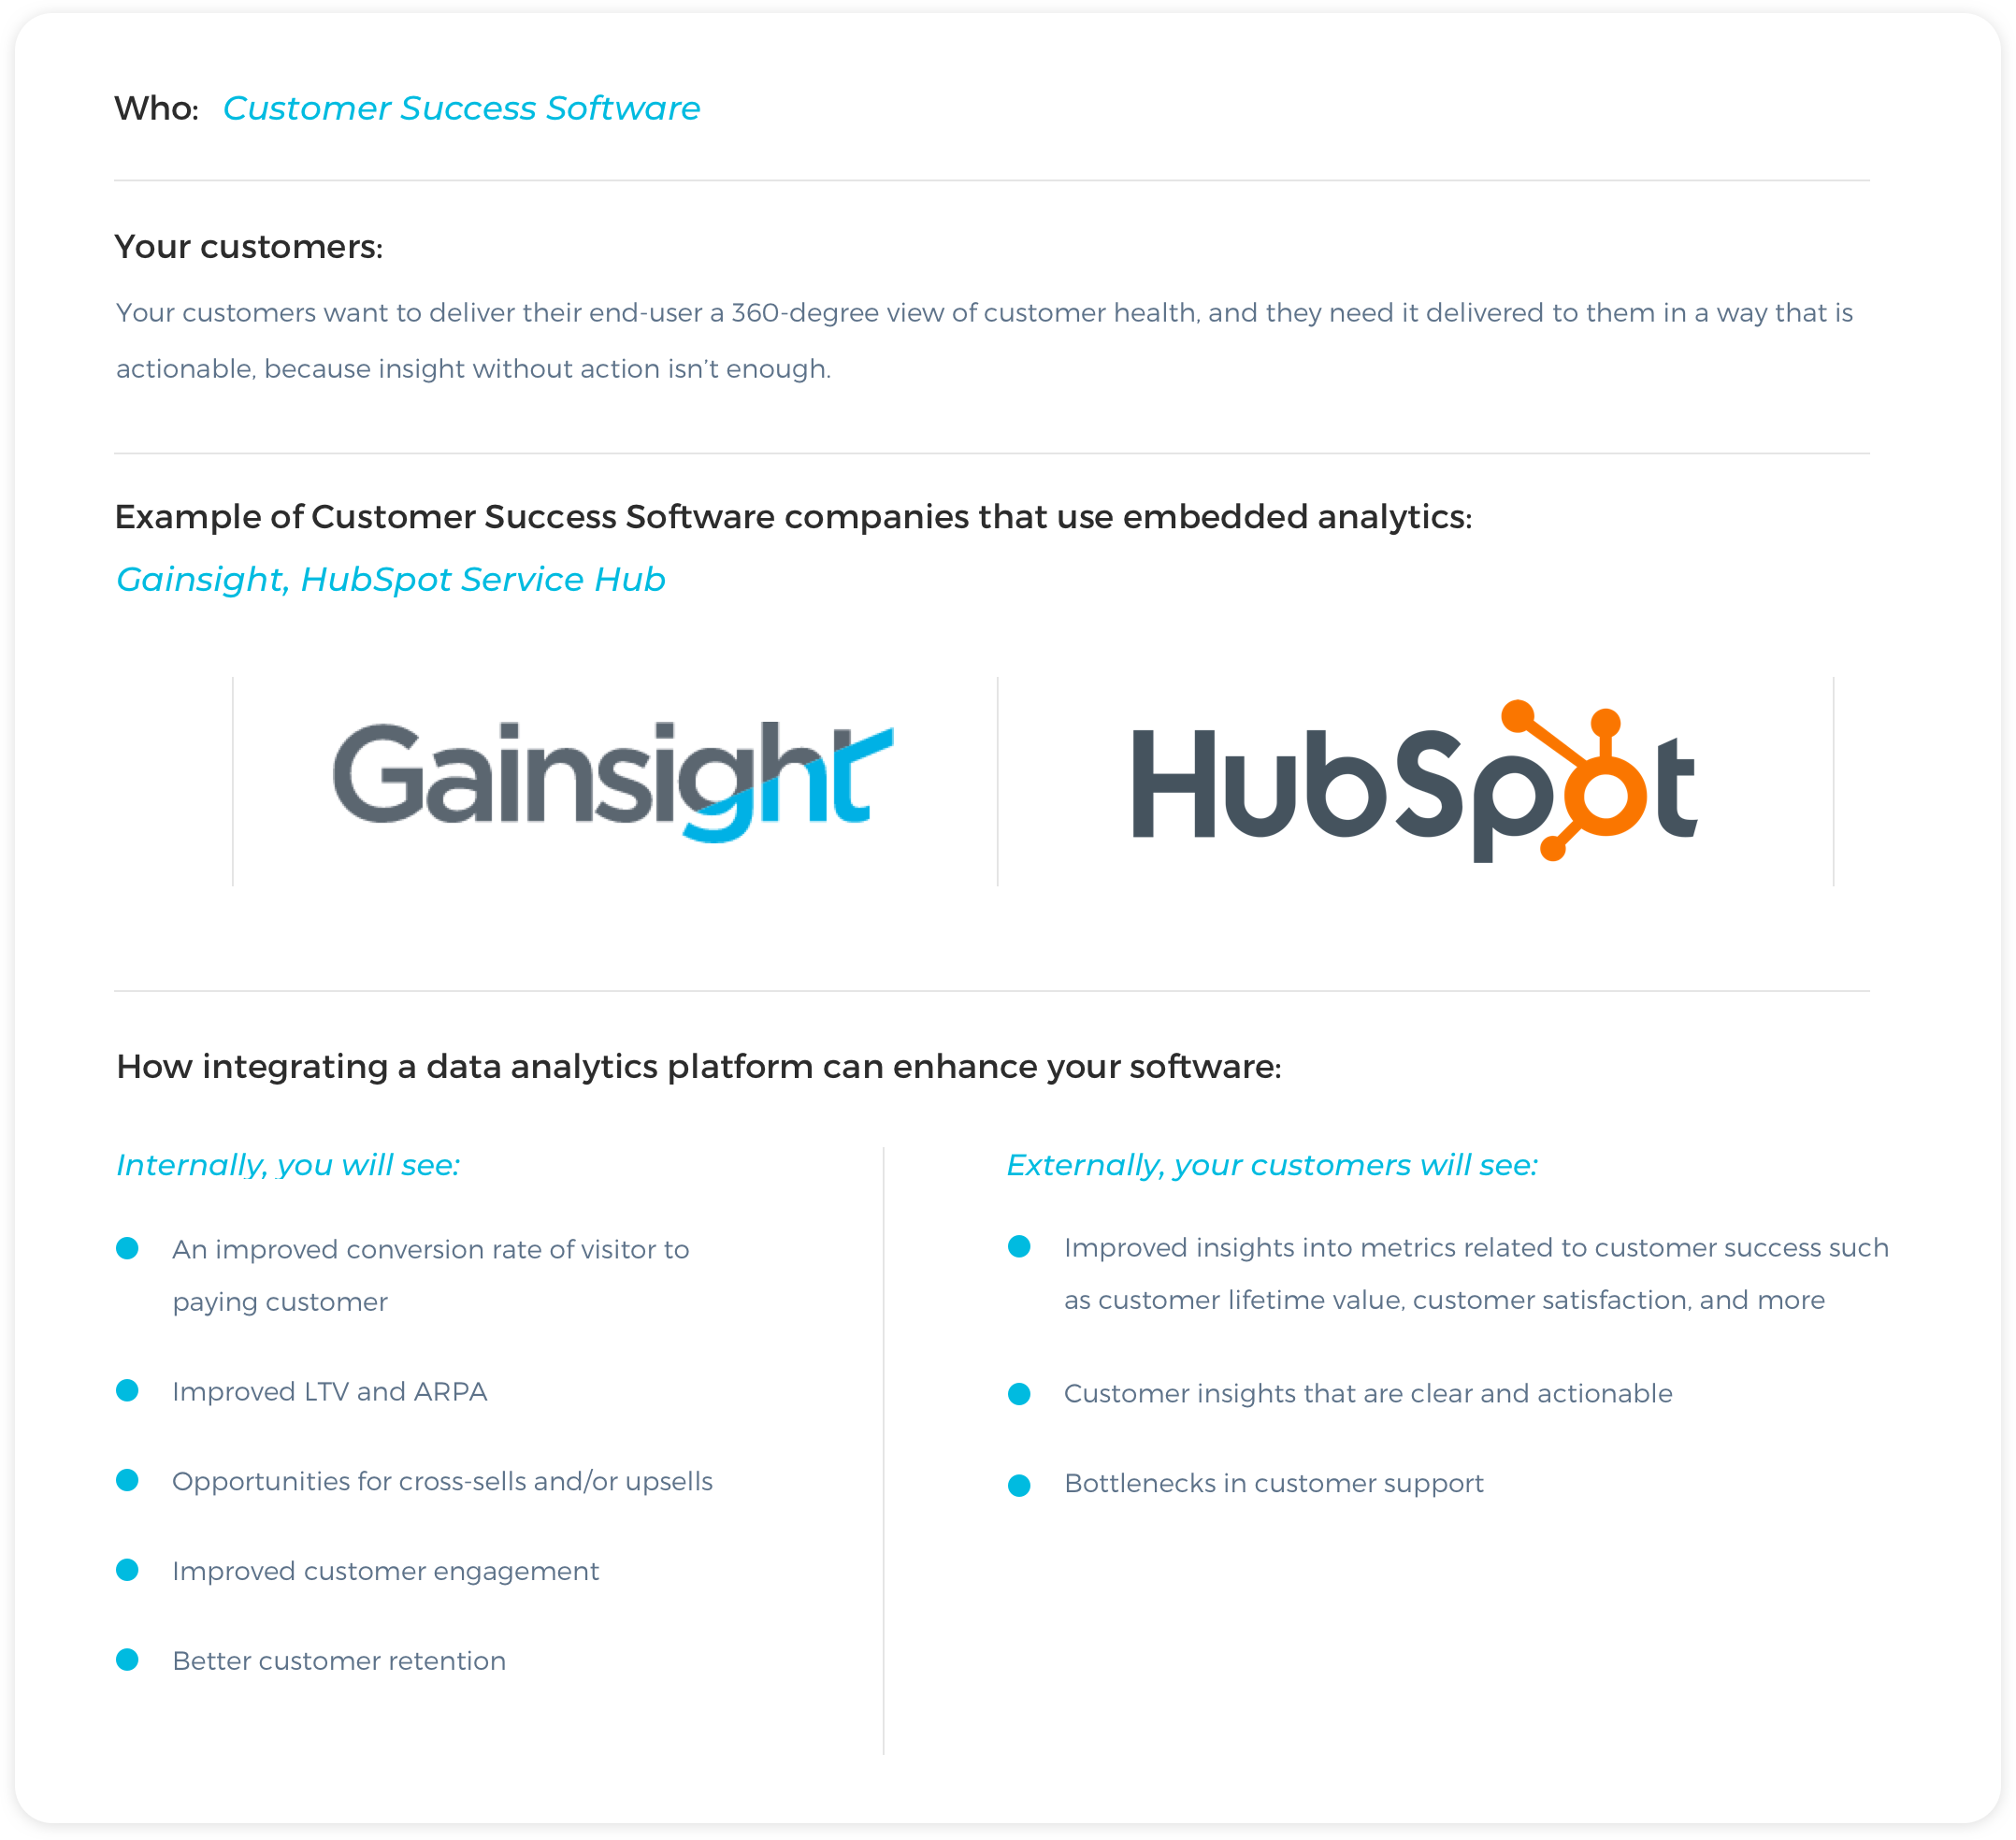
Goals and Current Challenges of Customer Success Software
What your customers need is to give the end-user (customer service managers and teams) clear insights into their current state of customer health. After all, without customers, a business would not exist. While many departments and teams may work with a customer at different touchpoints, what many companies lack is a way to focus on each customer individually.
The idea behind customer success is discovering meaningful insights and driving coordinated actions across the teams that will interact with the customer in order to deliver a better customer experience. Using software that breaks down customer analytics empowers the end-user to see where they are doing well, and where there is room for improvement. This state of customer health is measured through a number of customer success metrics. With that in mind, let’s explore what some of those customer success metrics are that your software should be tracking.
Customer Success Metrics
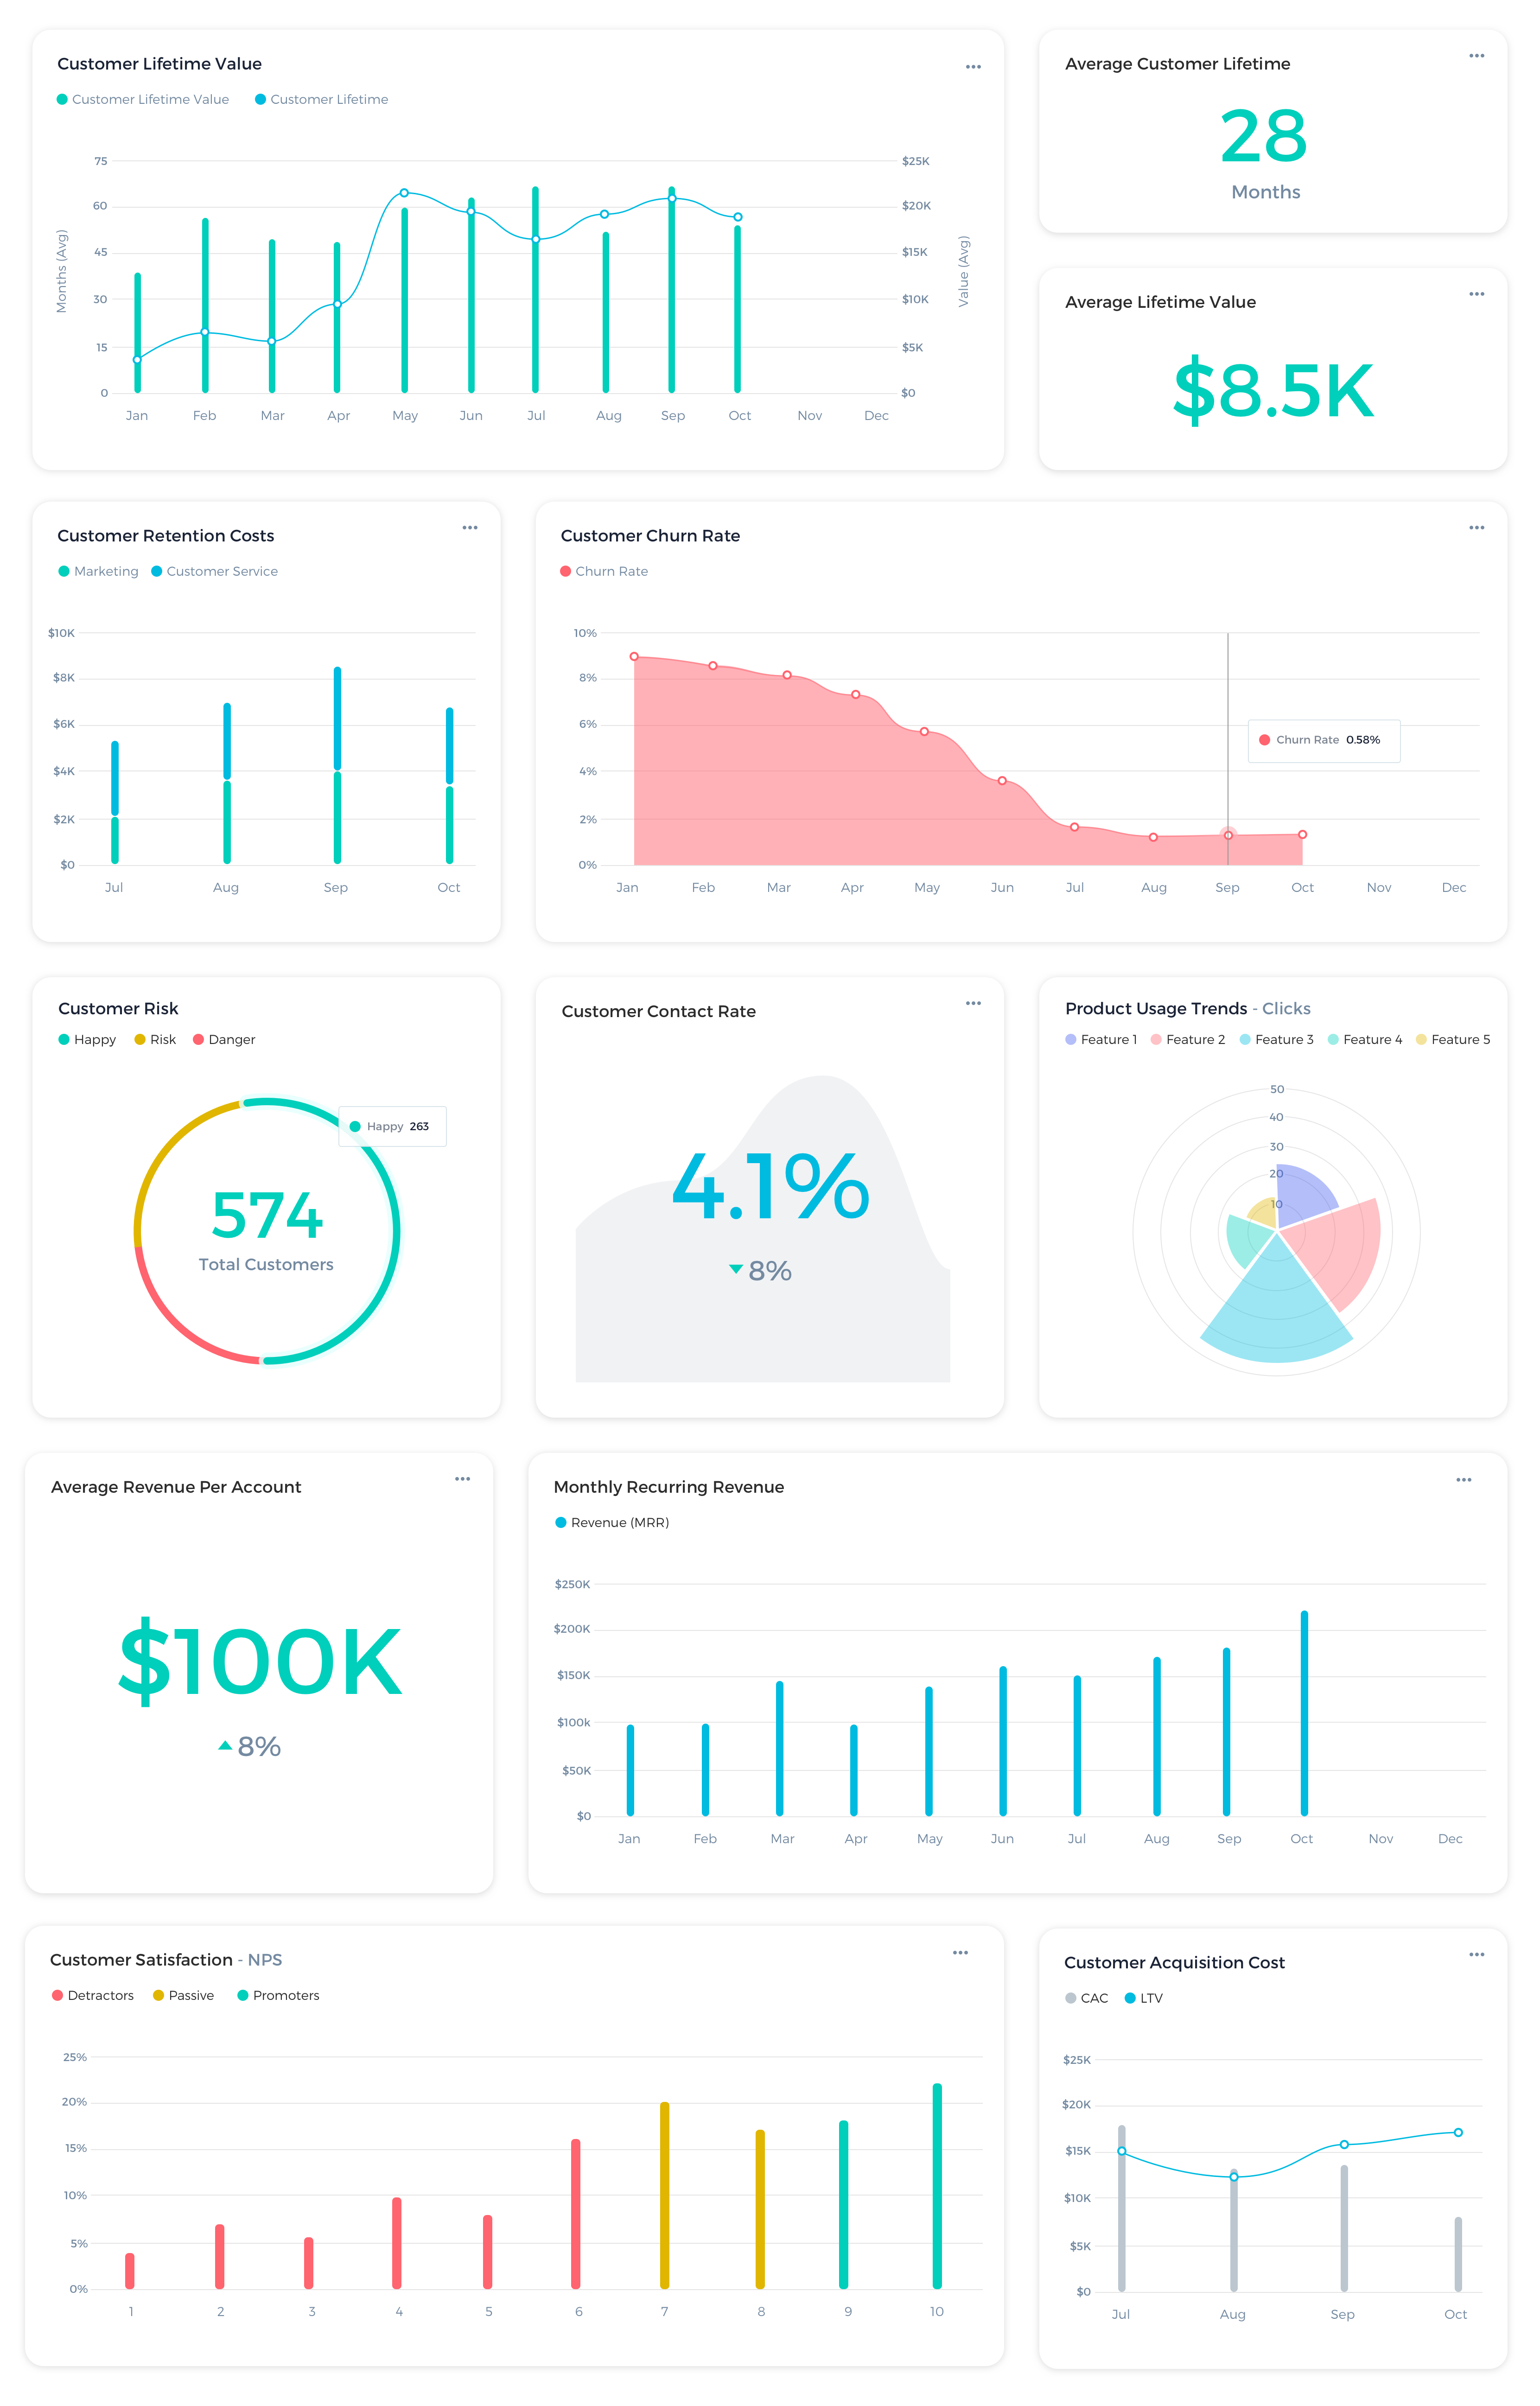
The metrics your customer analytics dashboards that are embedded within your software should be tracking include, but aren’t limited to:
- Customer Lifetime Value – This number is also called the customer LTV, not to be confused with the investment acronym LTV which stands for loan to value ratio. In measuring customer success, the customer LTV is the revenue earned from one single customer over time. Some customer service managers believe that this is the most important metric because it can predict a company’s success or failure. The goal is to increase this number for every customer by way of cross-sells and upsells, and ongoing purchases.
- Customer Retention Costs – From marketing to customer service, these costs are the ones made in the hope of increasing the length of time that a consumer stays on as a customer of a brand.
- Customer Churn Rate – The churn rate is the percentage of customers who don’t renew their subscription or stop making purchases in a given time period. This is often calculated monthly and is arrived at by dividing the number of customers you lost in a given month by the number of customers you had at the end of the previous month.
- Customer Risk – How many are green, yellow, or red in terms of customer health? Yellow and red should be given special attention to elevate them back to green. How your company defines what makes for a green, yellow, or red customer account may vary, but the main idea for most companies looks like this:
- Red: If the customer had to renew or purchase again tomorrow they would have a 50 percent chance or less of renewing/purchasing again
- Yellow: They have a 50 to 80 percent chance of renewing
- Green: They are more than 80 percent likely to renew
The goal with this metric is to evaluate who is not in the green zone, and then use other metrics to determine how best to go about getting each customer back to green.
- Customer Contact Rate – While people want to feel like they are more than just a number, and you should be in contact with them regularly to build the relationship, in the case of customer success, your customer contact rate is actually a metric you want to keep as low as possible.
The customer contact rate in this case is based on the number of inquiries a customer makes related to their product or service purchase. You arrive at the number by taking your total number of customer inquiries that occur through your ticketing and/or phone system in any given time period (i.e. a month or year), and dividing the number by the amount of paid orders for that time. You want this number to be low because it means that your customers are enjoying the purchase and aren’t having trouble with it.
The easiest way to reduce your customer contact rate is to provide self-service tools that allow the customer to resolve any issues they may have without needing support from a representative.
- Product Usage Trends – How the customer is using a product/service could indicate opportunities for upgrading or coaching. Let’s say your customer purchases software and hasn’t logged in for several days. This could tell your support staff that the customer needs help understanding how the program works. By reaching out to them with a tutorial for example, you might help the customer to be able to use the product and keep them onboard as a paying client.
Another example could be that the customer has reached the limits of what their purchase can do, and they need an upgrade. Let’s say it’s for software that has tiered plans for 100 members, 101-250 members, and 251-500 members. If your usage data indicates they are getting close to that 100 member mark, it’s a prime opportunity to reach out and remind them of your next levels pricing tiers so they can continue using your product.
- Average Revenue Per Account – Also referred to as ARPA, the average revenue per account is pretty self-explanatory. It’s the average amount of income a company earns for every customer that it has. If a company earns $100,000 and has 100 customers, its ARPA would be $1,000.
- Monthly Recurring Revenue – Just like it sounds, this number represents the amount of revenue coming in consistently each month. This is important for telling a company how much income they can expect month-over-month. If there are increases or decreases in the number it can indicate whether sales or going up or down. If your company uses subscription services, for example, this metric can indicate whether subscriptions are increasing or decreasing.
- Customer Satisfaction – This number is typically related to several metrics. By analyzing multiple numbers, a company can get a score related to a customer’s overall satisfaction. The higher this number is, the better. Monitoring this number can be helpful in identifying the customers that are most likely to cancel subscriptions, downgrade, or stop buying altogether. One metric that can illustrate a customer’s level of satisfaction is called the Net Promoter Score, or NPS.
- Churn Trends – By analyzing other metrics in this list, you can start to paint a picture as to the most likely times customers could churn. For example, churn rates may increase if a lot of people are in the yellow and red zones in terms of the customer risk metric. Or if customer satisfaction, average revenue per account, and monthly recurring revenue are going down, churn could go up. Product usage trends can also be related to churn. If customers don’t understand your product, or have outgrown its limitations, they may seek an alternative product. However, if you’re watching other metrics, and find they are related to your company’s churn trends, you may be able to prevent churn from occurring.
- Customer Acquisition Rate – This metric is also referred to as a customer acquisition cost or CAC. If your CAC is higher than your LTV, or even if these numbers are equal, your business has a lot of room for improvement. This metric is arrived at from looking at the numbers for things like marketing, manufacturing costs, R&D, etc… Basically every cost that goes into convincing a customer to buy is included in a CAC.
This list barely scratches the surface of what your customers’ end-users are looking for. Hopefully, it has at least gotten you into their mindset so that you can think about what to include in your own software. Once you decide to create a customer analytics dashboard, the next decision is how to go about building it into your software.
Options for Embedded Customer Analytics in Your Customer Success Software
You know your customers want embedded customer analytics, and that they want them delivered in a visual dashboard that is actionable. How can you deliver it to them? There are two main options most software developers come to:
- Building a custom solution from scratch, or
- Buying a ready-made product that they can implement out of the box
Both options may or may not give you exactly what you’re looking for. Building a custom solution can cost significant time and resources, but may never be completed. Buying something ready-made may have limitations, and not address all of the needs of your customers and end-users. You can learn more about these options in our Build vs. Buy Whitepaper.
If you’re like most software developers, after considering these options you’ll wish there was a better solution. Luckily, there is, and it’s Keen, the embedded analytics API that helps you deliver customer-facing metrics that your users and their end-users want and need to measure the state of customer health.
The good news doesn’t stop there. Not only can Keen give you the best of both worlds, but you also don’t even need a mock-up to get started. Just bring your ideas and plans to Keen’s data visualization experts, and they will partner with you in developing an intuitive dashboard guaranteed to impress.
The process couldn’t be easier. In fact, building a solution with Keen is as simple as copy and paste! The best part is they will be with you every step of the build as you create something amazing, and then they will stay on to assist with maintenance and any tweaks your software may need.
Your customers end-users want to connect with customers, exceed their expectations, and turn them into loyal advocates. Tracking customer analytics is critical for them to ensure that their customer success rates are as high as possible. If your software isn’t giving them the tools they need to measure the state of customer health, they will move on to another platform that will. You can’t afford to not deliver the customer-facing metrics they are looking for. Contact our team to get started with Keen today!