These days, data is gold. It can teach us so much about our customers. With enough data we can determine what they want, how they are likely to act in the future, and give a pretty thorough history of past actions.
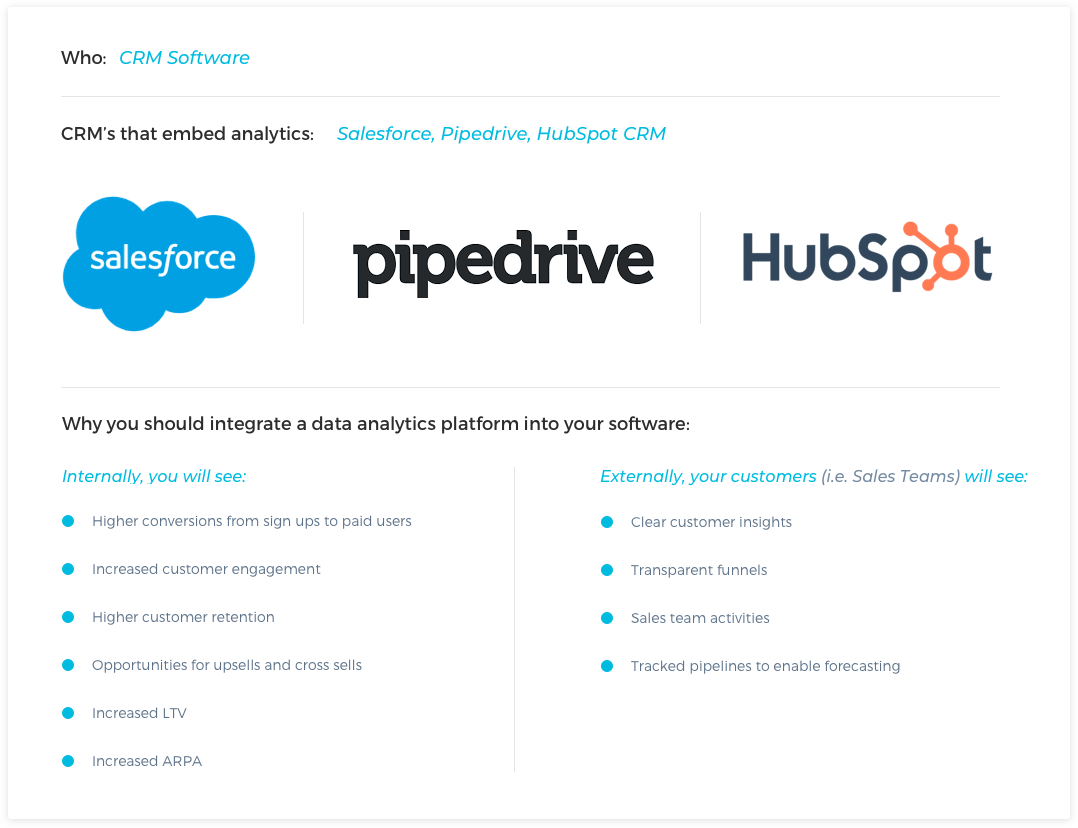
When developing CRM software, it’s wise to take note that your customers will want access to various types of analytics and data. Data you’re already collecting in the CRM. But, they’ll want it in an easy to digest platform. If you can’t give them the analytics they are looking for, you could lose them to a competing CRM solution.
The key to successfully acquiring your prospect over a competitor? Customer-facing metrics.
Customer-facing metrics allow you to share performance data and usage with your customers on the front-end, which highlights your product’s value.
The trick is that you need to organize and distribute the data that is being collected in a way that makes sense to your customers. How can they act on it if they don’t understand it? Numbers are just numbers without clear context, after all.
Your customers want to know how this data will help their own business grow. They want actionable data that is clear and concise. They want CRM analytics that help them make clear business decisions towards growth and success. We’ve said it before and we’ll say it again — the only way to do that is with data.
Are Embedded Analytics for You?
Outcomes for all: In order to make key decisions and analyze performance, you need sales dashboards.
Insert Keen — We’re the embedded analytics API that is shaking things up in the SaaS industry for the better. We make it easier than ever before to take the data you collect, and present it to your customers in a user-friendly way.
Every action a user takes using your software holds event data. Keen transforms that event data into powerful visuals that can natively integrate large-scale analytics into anything and everything you create.
With our intuitive and seamless API, you have total control over the data you capture, and how you use it in your applications. Meaning, you can scale faster, and your CRM software can be more intelligent — all without the need for big data infrastructure.
Current Challenges that CRM Software Faces
With most CRM solutions, the idea is to manage your business-to-customer relationships. It’s also used to manage business contacts, clients, sales leads, closed sales, employees, etc. What your customers want now more than ever is a better solution to analyze all of the pieces of information they are collecting, analyze it, and make actionable growth plans moving forward based on these metrics.
By combining your CRM software with our analytics APIs, you can provide your customers with line graphs, bar charts, pie charts, maps, and more that will provide them with a bird’s eye view of how things are progressing in their business.
For example, if they want to know which age groups are buying the most products, the data can be broken down to display that exact information they are looking for. This will tell your customers where they should be increasing or decreasing their marketing and promotional efforts.
By taking the data that is already being collected into your CRM software, and transforming it into actionable charts and graphs, you are empowering your customers to make more informed key decisions. And, you are preventing them from the need to seek out other solutions to get these metrics and reports, or from manually creating them on their own.
Choosing Which Sales Dashboard to Embed
Take a look at the metrics in play. Most CRM software collects things like:
- Names
- Emails
- Phone Numbers
- Websites
- Social Media Handles and so on
You will need to determine not only who on the team the dashboard will be for, but what type of metrics, charts and graphs you would like to see that are catered to them, such as comparisons, compositions, and trends. The three types of sales dashboards we will be highlighting below are the:
- Sales Management Dashboard
- Individual Sales Rep Dashboard
- Company Based Deal Dashboard
Sales Dashboard for Management Teams
A strong sales dashboard for your management team will visualize sales teams by region in comparison to each other, including things like the following:
- Closed/Won deals broken down by region: How is each region stacking up against each other, are there any glaring numbers that need to be addressed before it’s too late
- Total revenue growth for all regions combined: This can also be found on a Company Wide Deal Dashboard, but it is something that managers need to see as they work towards a common goal with other regional sales teams
- Monthly revenue attributable to each team: Get an inside look at how the total revenue is broken down on a monthly basis between regional teams
- Average days to close for each regional team and close rates: Easily identify areas for improvement
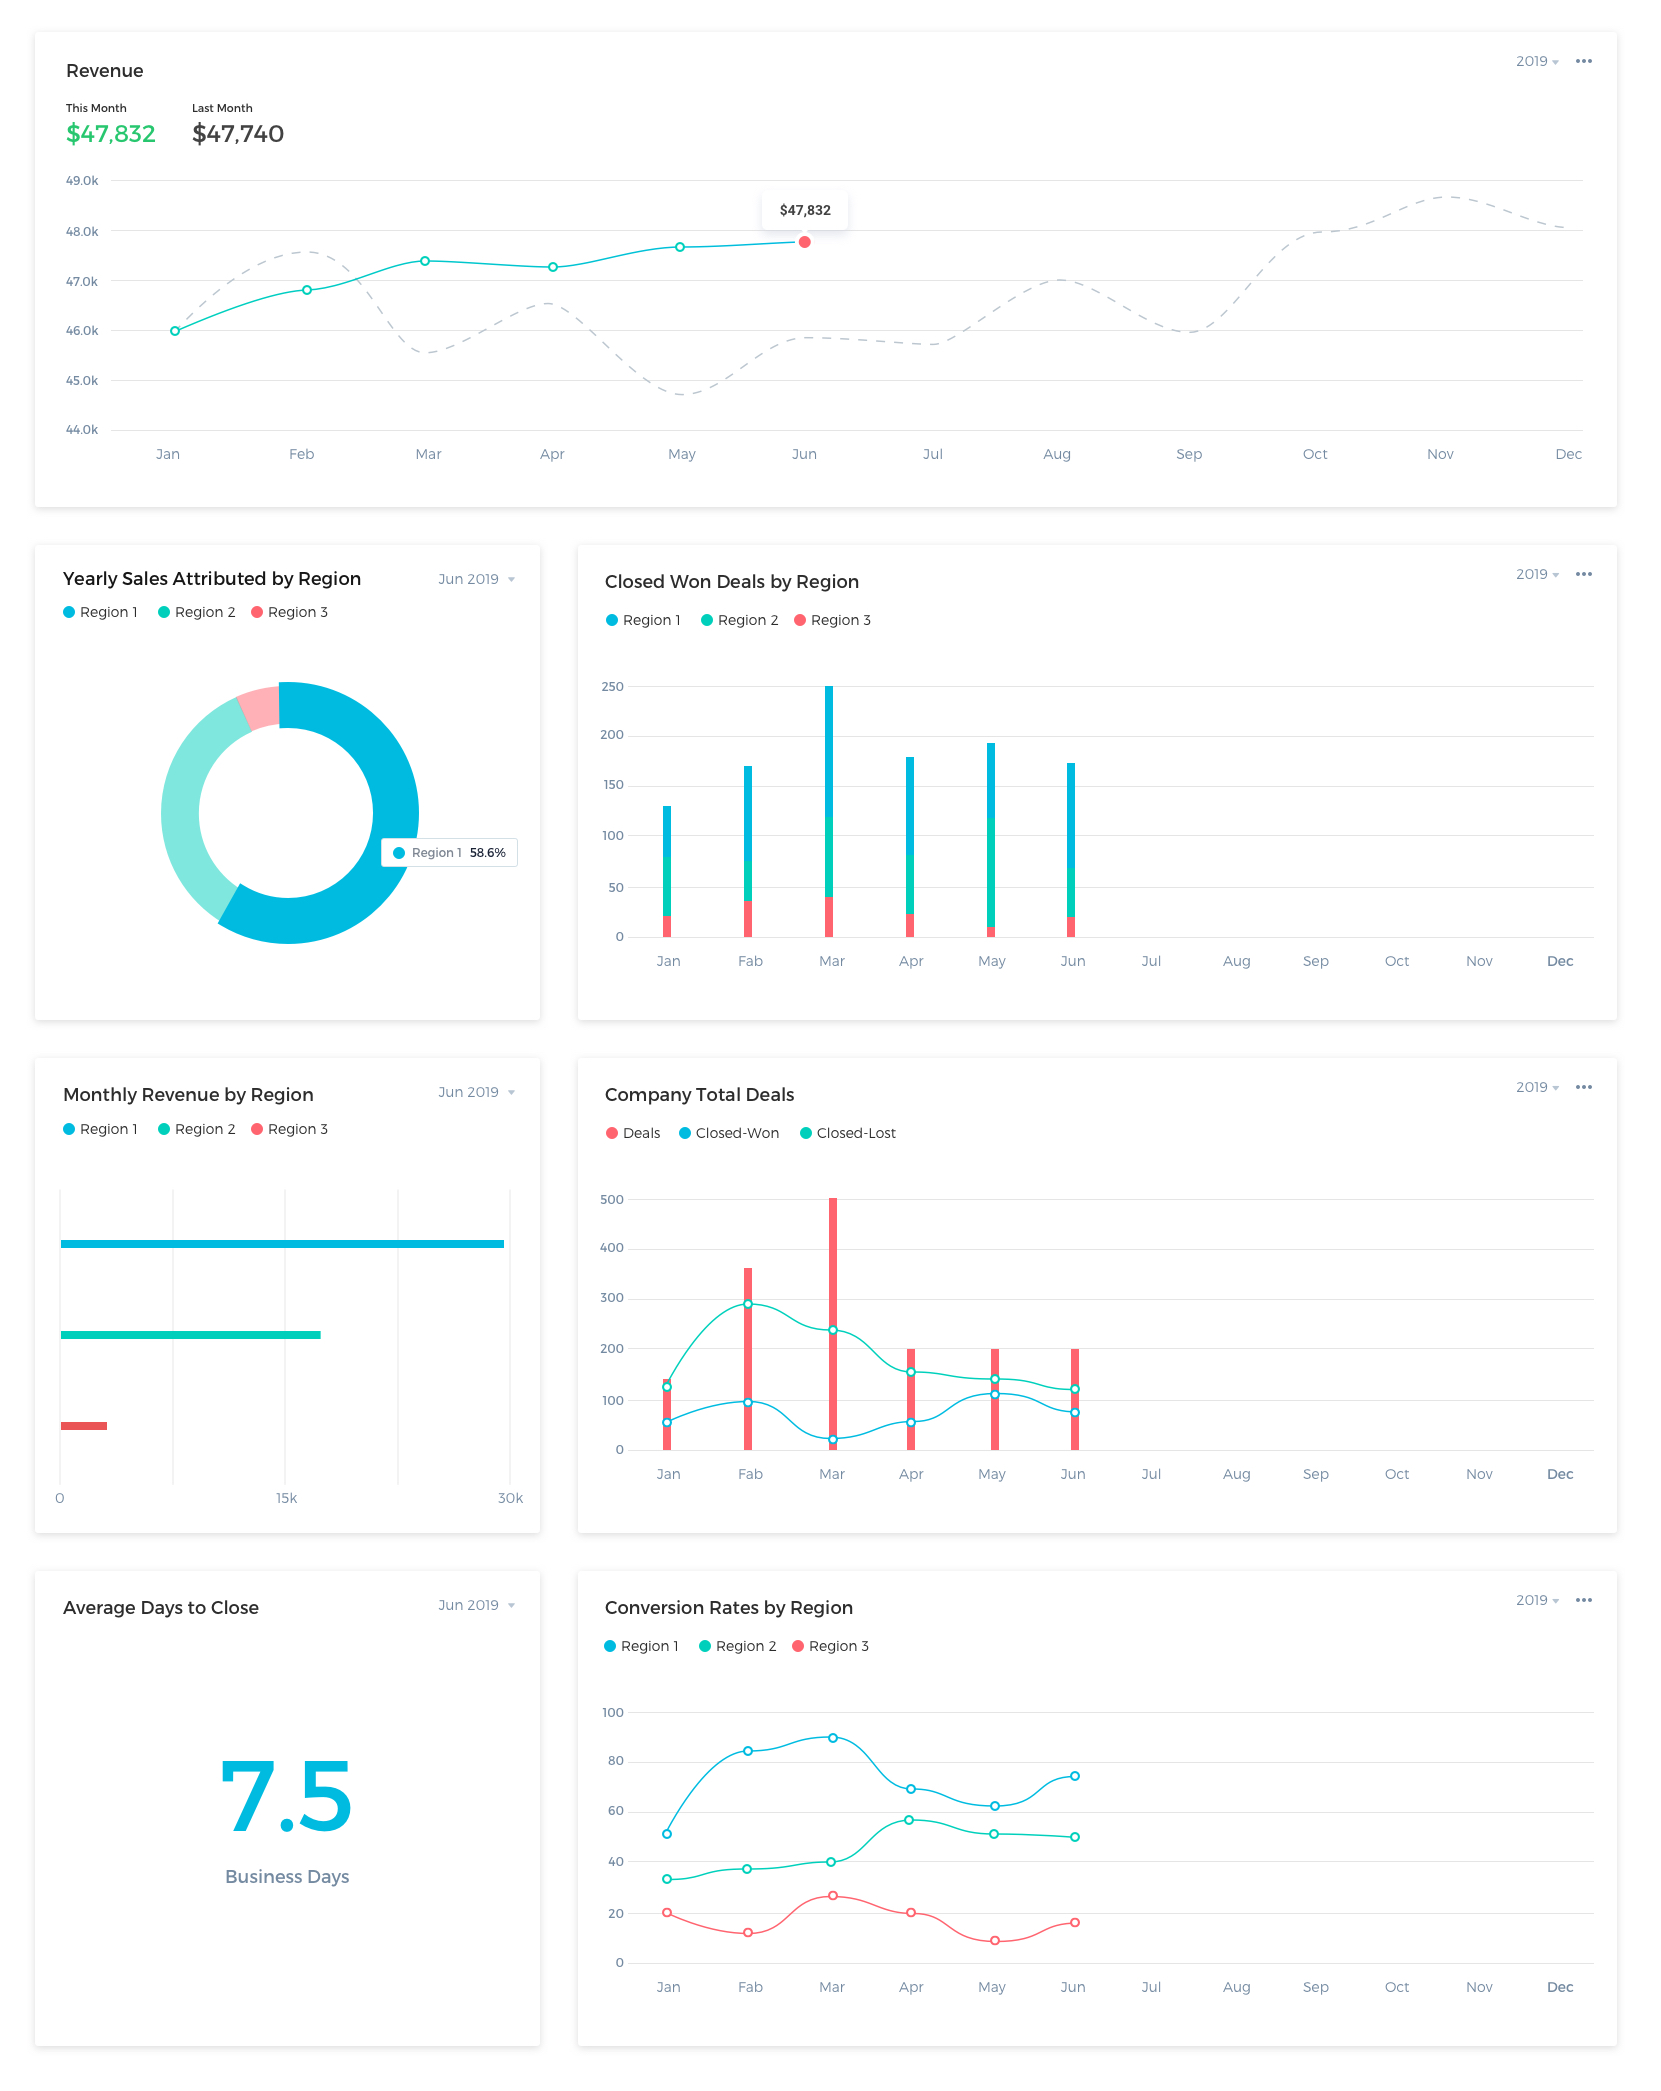
Being able to visualize data in this regard helps management forecast new targets for achievement and manage how to improve sales company wide.
Sales Dashboard for Individual Sales Reps
Imagine creating a way to show a sales rep how they have progressed by week, month, or even by year. This could make it easier for your customers to offer incentives to their sales teams based on sales during a period of time.
This would also allow the sales rep using the system to see how they are doing in terms of their own performance. Sales reps could even compare their current results with previous days, weeks, or months so they know if they are improving, and where to double their efforts.
A strong sales dashboard for sales representatives will track individual sales reps performance by monitoring metrics such as:
- Meetings booked vs goal: Give yourself a clear visualization of where you currently stand at any given time in the month in conjunction with your goal, as well as how your current efforts are in comparison to last month
- Opportunities projected to close: This will show you a breakdown of outstanding opportunities based on how long they’ve been in your pipeline
- Deals won: How many deals have you closed on a weekly scale this month as compared to last
- Deals lost: How many deals have you unfortunately lost on a weekly scale this month as compared to last
- Attributed revenue: How much revenue have you brought in each week this month?
- Close rate: It would take a good amount of leg work to calculate at any given time what your current close rate is.
- Time tracking: Log the amount of time spent on meetings, calls, and emailing prospective leads
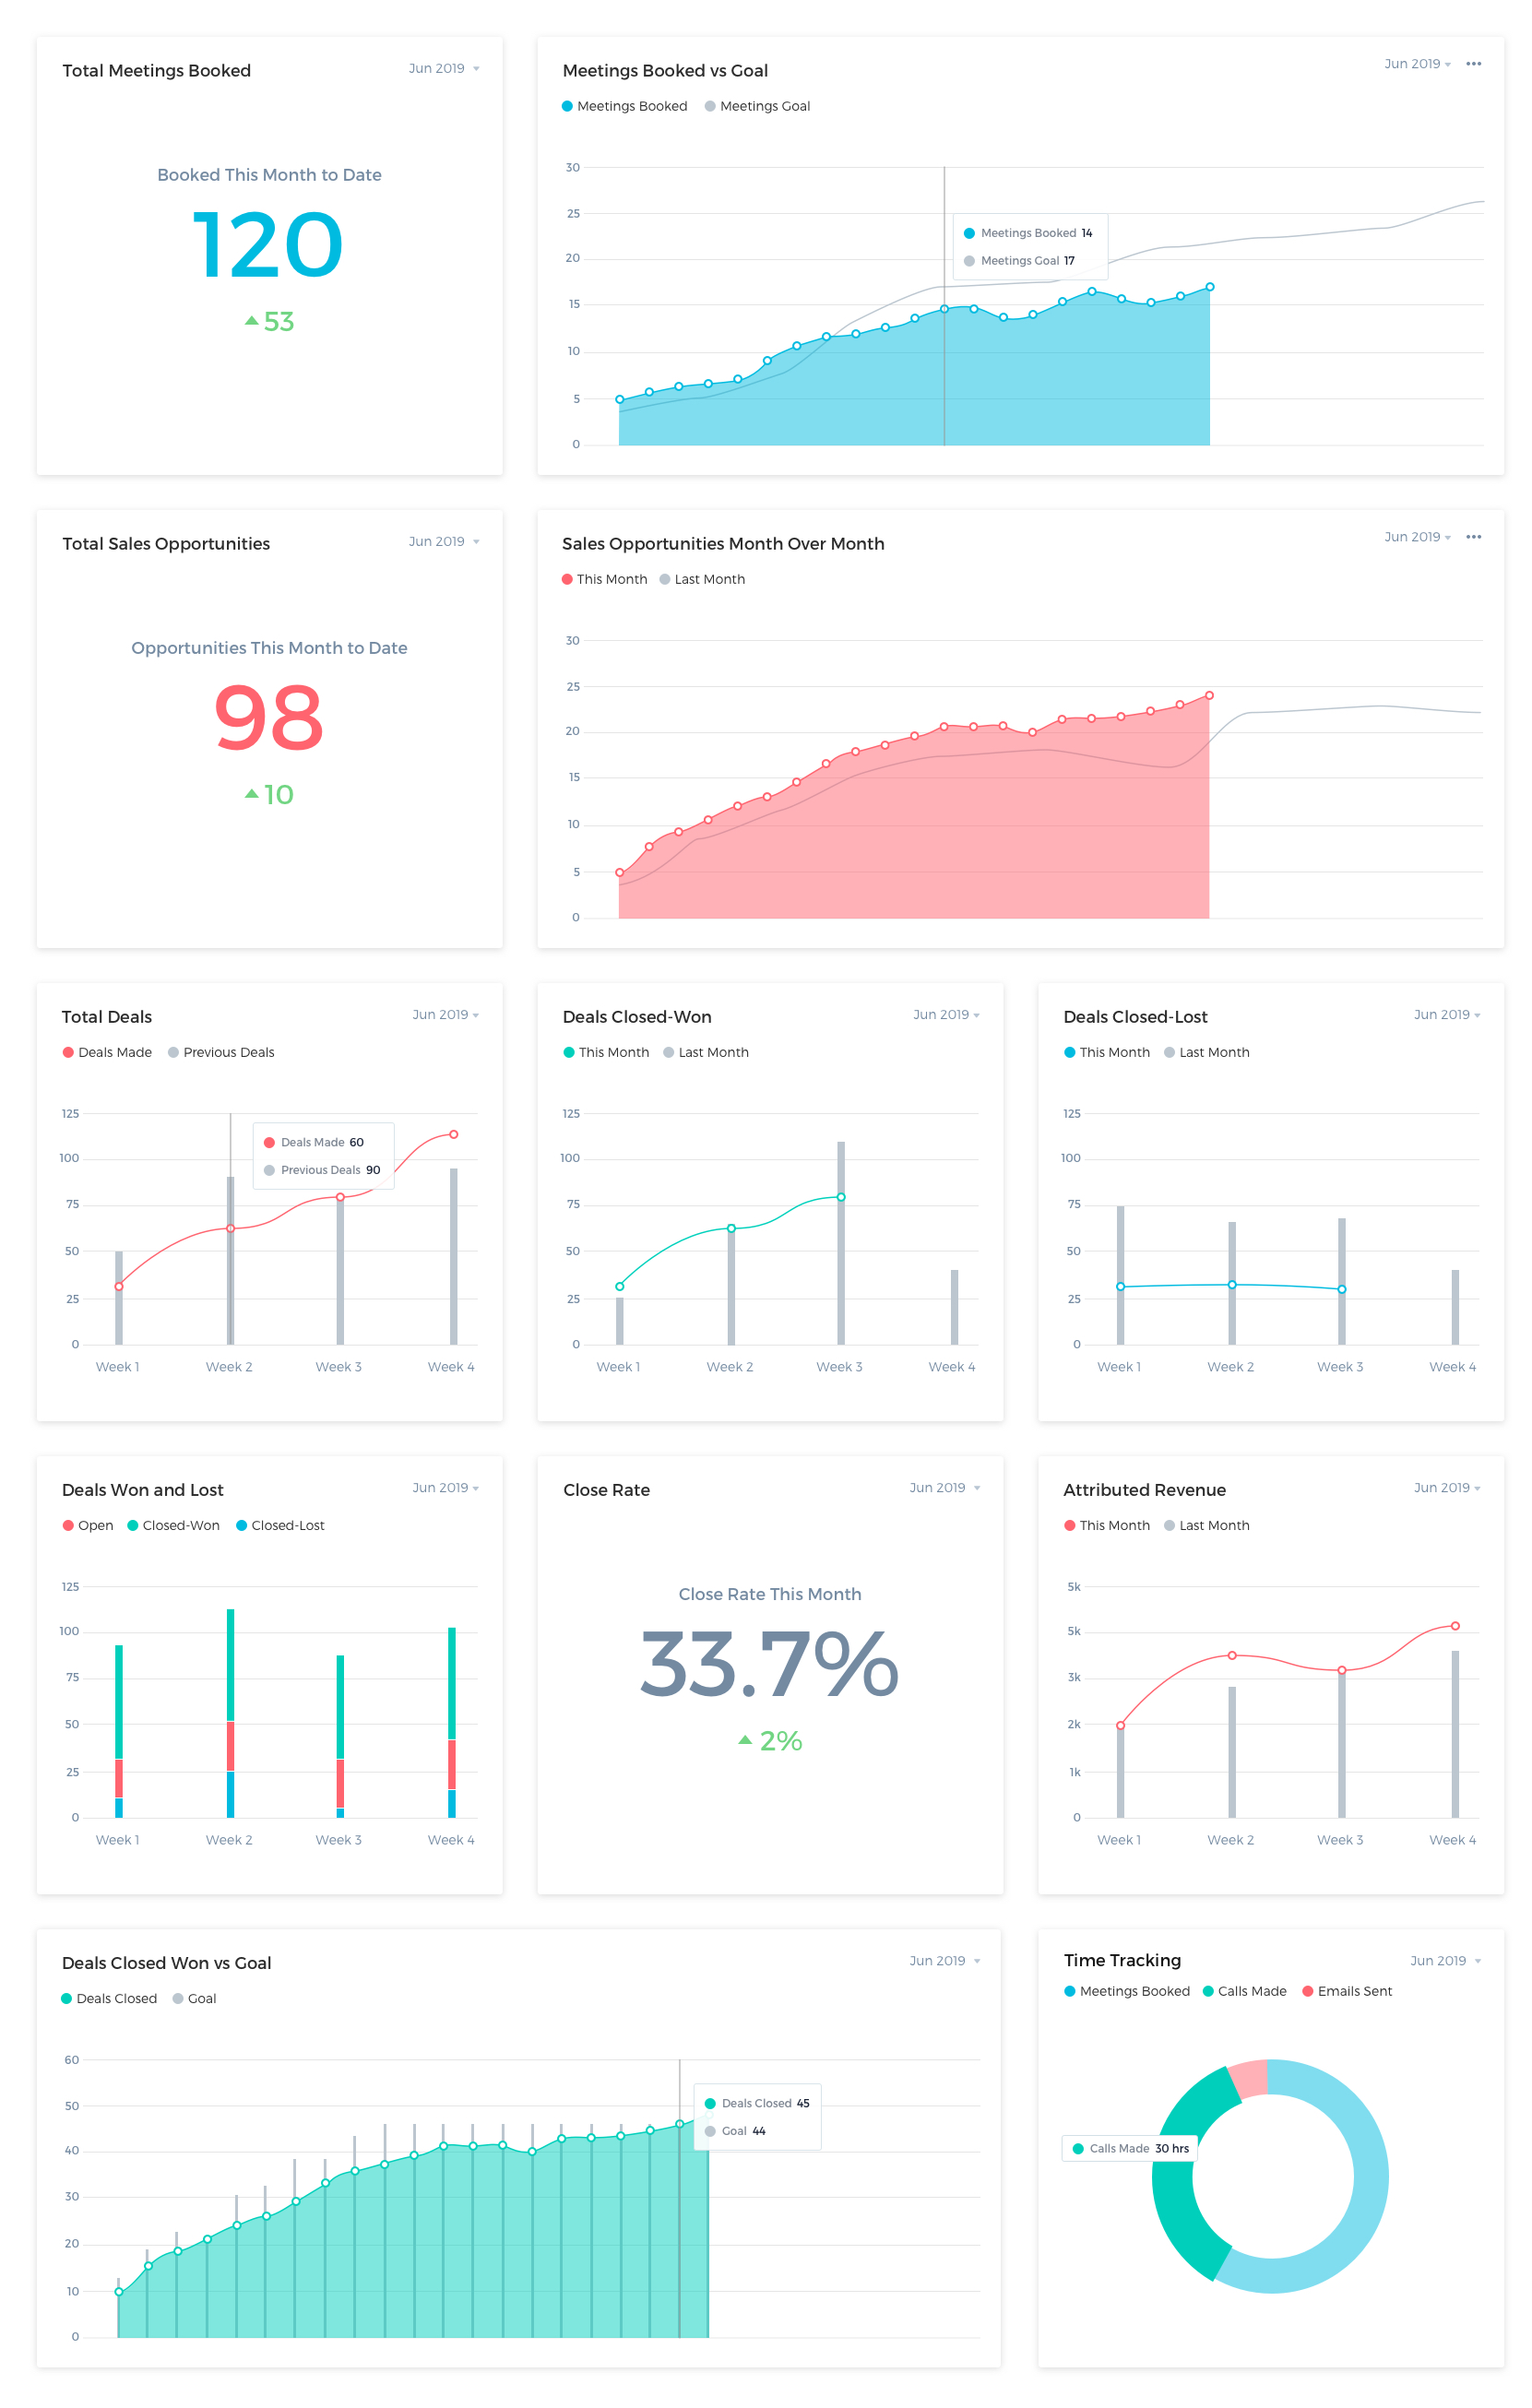
By being able to visualize the data on an individual level you gain better insights into individual performance and areas for improvement.
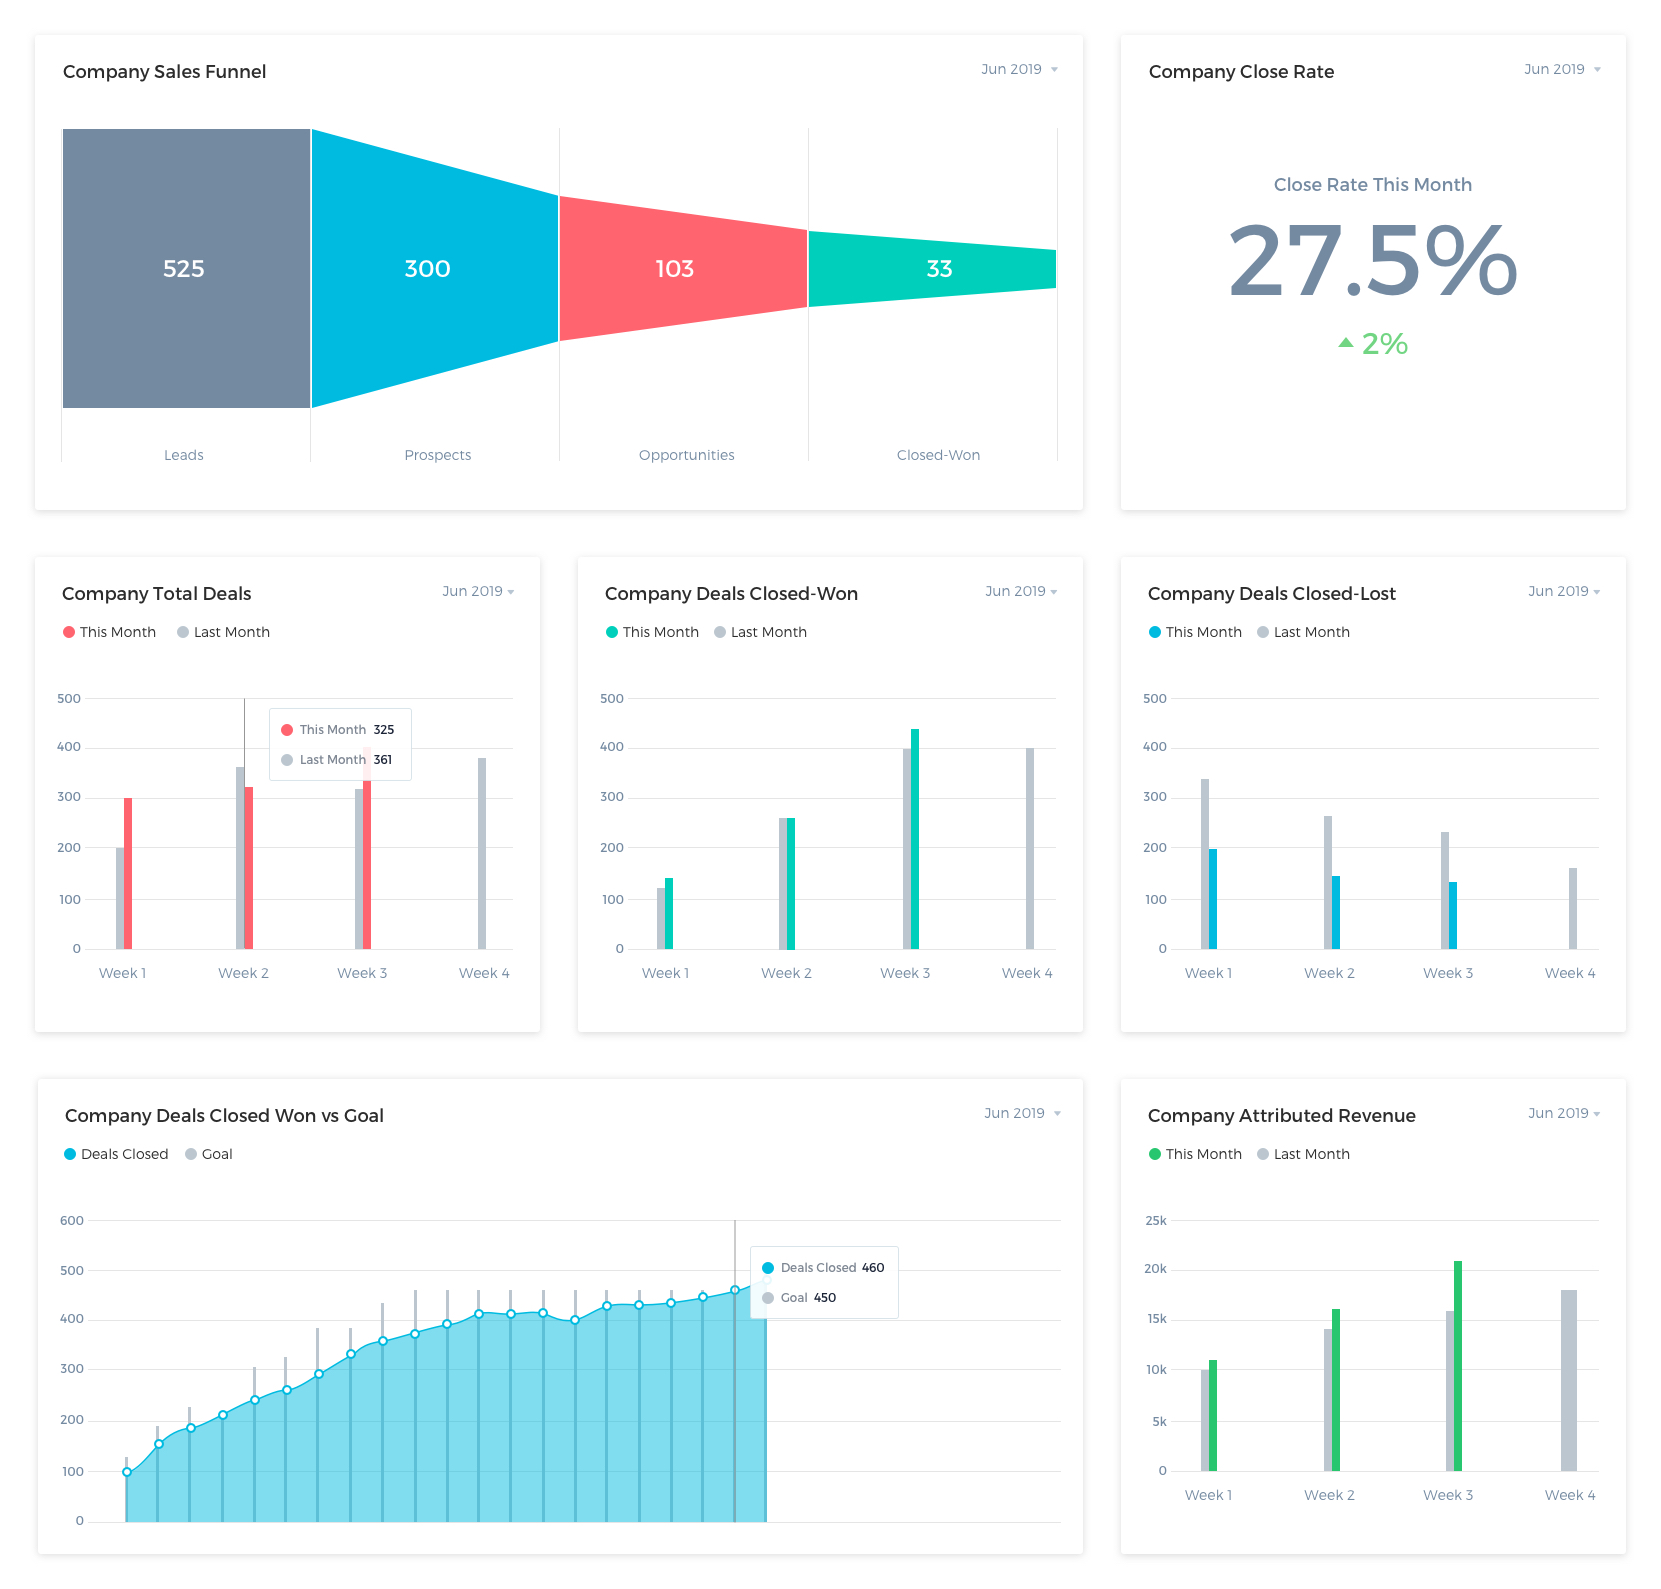
Company Wide Deals Sales Dashboard for Company Wide Metrics
At a quick glance, a deals dashboard will give you insights into company wide metrics that capture:
- The day-to-day actuals of the deals
- Where and how many leads are in the sales funnel at any given time, and
- A comparison to this time last week, month, or year
What makes for a strong sales dashboard that displays your deals? It should include some or all of the following:
- Representation of the sales funnel: Provides a visual funnel for benchmarking against actuals and forecasting future goals
- Current monthly close rate: A look at the company wide close rate
- Deals won/lost in the current month: When cross referenced with deals won/lost in the previous month this metric will give you a visual of how you are stacking up in your efforts company wide, not just region / team / individual sales rep based
- Revenue totals: Company wide earned revenue on a weekly / monthly scale in comparison to the previous month
Of course, you can include additional metrics or remove metrics from any of the aforementioned sales dashboards depending on what your customers want or need.
Embedding Customer-Facing Metrics in CRM Software
You most likely can see how offering your customers a way to transform their raw data into effective visualization using CRM analytics can add value to your product. Once you decide to add this offering, what is the best way to go about it?
At the end of the day and much research, you will realize there are two main options:
- Build from scratch: The longer and more complex route
- Buy and implement: The faster and simpler route
Build a custom analytics solution for your CRM Software in-house.
Doing this gives you complete control and ownership over the infrastructure and the data analytics. You will also have complete flexibility in querying and the display of data. It’s also a nice feather in the cap of anyone on your development team to build something like this from scratch.
The trouble is building something this massive can be an expensive undertaking. If you’re a startup with a limited budget, there will inevitably need to be a time and money consideration. While part of the benefit of being small might be speed to market, but you have to keep in mind that developing from scratch might take longer than you can afford. Other problems include the risk of big mistakes, inability to complete the project, and difficulty hiring the right team to get the job done.
Additionally, you may find that you’ll end up with a inflexible/brittle subpar solution that will require routine maintenance, reworking, and upkeep as your product and customer base scale.
Build your data platform hand-in-hand with an easy to use solution like Keen.
When you combine your CRM software with Keen’s platform, you get the best of both worlds. We can help you design it to spec. Simply bring us your mock-ups, and we will implement a data model and front-end experience to match.
If you don’t have a mockup quite yet, fret not! Our data visualization experts can help you design a beautiful dashboard that your customers will love.
With us by your side, you can build and customize your data, easily integrate with other existing applications and platforms, and spend less time and money launching your solution. Imagine customer-facing metrics being as easy as copying and pasting!
The best part is, you will be supported by Keen’s team of engineers and designers dedicated to helping you future-proof your strategy, and who will aid you in creating the perfect solution for your software every step of the way.
After the custom metrics are embedded, Keen will handle the management and the maintenance that ensures your product dashboards are operating smoothly. From security to scalability, we’ve got your back.
We cover the difference in these options more in depth in our whitepaper Build vs. Buy.
The bottom line is this – a platform such as ours helps you create the visuals your customers want, faster and easier than ever before.
You need to be on the leading edge to stay ahead of your competitors.
Keen makes this a reality quickly and efficiently. We believe that companies who use data effectively will outcompete the ones that don’t. Want to learn more about Keen?