
In today’s digital marketing landscape, AdTech companies with the capability to give customers a way to display ad metrics are popping up everywhere. The ability to precisely target your audience online can reap great rewards for your marketing and revenue objectives, and entrepreneurs and founders are taking note.
But how do you know if your AdTech efforts are successful? How do you know if your customers’ campaigns are successful? More importantly, how do your customers know that your AdTech product is working for them?
That’s where AdTech Analytics and Metrics come in.
Companies like AdRoll, AdEspresso, Facebook, and Twitter all have ad platforms that display AdTech analytics and metrics to their customers. We’ll show you how you can build and embed these kinds of analytics into your products, too — with real-time results and unlimited scalability.
Spoiler alert: it’s actually pretty easy to do.
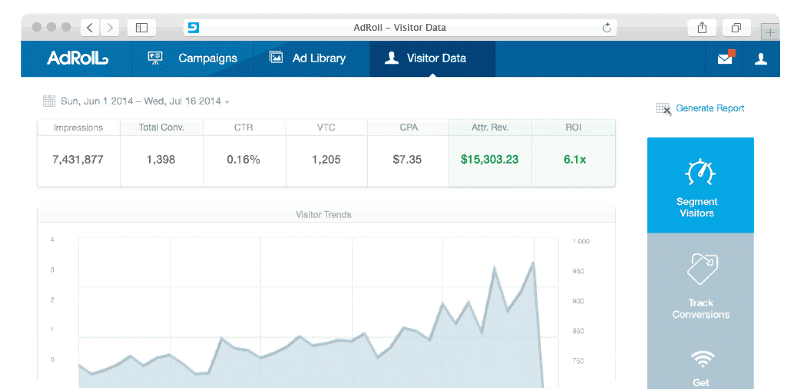
AdRoll’s AdTech Dashboard
Focus on What’s Unique
Building an AdTech platform can be quite complicated. From building responsive ad units to creating detailed customer segments, countless hours must be spent on the delivery of ads. So once an ad is running and racking up views, clicks, and revenue, you want to make sure you can store and display this data in a scalable and real-time manner.
To do this, first you’ll need a scalable data infrastructure for data storage and collection, and then you’ll need a way to query and display individualized data to each of your clients. We’ll show you how you can do all of this, starting with the first order of business: figuring out which display ad metrics you need to track and display.
Display Ad Metrics that Matter
So you’ve built an AdTech platform that can place and serve up ads for your clients. Great! The next thing a client will want to know is “Are my campaigns performing?” To answer this question, it’s super important to know what metrics you should be surfacing for your clients.
To get you started, here are six key metrics for technology companies used by leading advertising providers such as Facebook and Google use:
- Impressions: the number of people who have seen an ad, with a breakdown between Unique Impressions and Total Impressions.
- Exposure: the average number of times an ad is served per person.
- Engagement Rate: the number of people who have “engaged” as a percentage of all ad views. For most ads, an engagement is typically a click-through to the advertiser’s site, but can be a video play or other interaction.
- Conversion Rate: the percentage of people that convert on a desired outcome, such as becoming a paying customer, as a result of an engagement.
- Relevance Score: a score between 1 and 10 that indicates an ad’s effectiveness and relevance to an audience, calculated by combining other metrics such as Conversion and Engagement Rates.
- Revenue: total value of all purchases made as a result of an engagement with an ad or campaign.
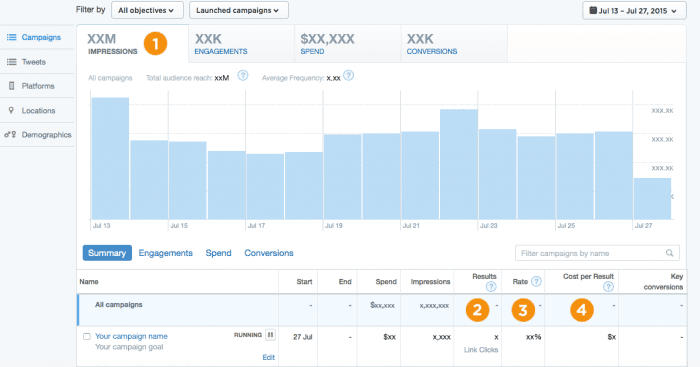
Twitter’s AdTech dashboard
Using the right data model, you can produce these display ad metrics with only three events:
- Ad Views: runs once on ad load.
- Engagement: runs each time a user engages with an ad.
- Purchases: runs once after a purchase is completed on a client’s site.
These three events also support standard metrics like User Locations and Referral Sources if such information is needed.
Now that you’re familiar with what to track, you’re ready to learn why the above display advertising metrics are so important.
Why Certain AdTech Metrics are Important
You might be familiar with the metrics of Impressions, Exposure, Engagement Rate, Conversion Rate, Relevance Score, and Revenue but here’s a quick refresher as to why they matter:
Impressions
Guaranteed to be the largest number on a dashboard, Impressions, which are the total views of an ad, is crucial when quickly assessing the success (or failure) of an ad campaign.
Sure, Impressions alone don’t specify how many people interacted with an ad, but even Google understands the importance of being seen by thousands of potential customers, which can be very exciting for your clients. Where metrics like Engagement Rate show actual interactions, Impressions show the possibilities of untapped engagement, seemingly limited only by the size of the audience.
In addition, with Interactive Advertising Bureau’s in-progress Viewability Standard, now more than ever, an impression means someone has actually viewed a client’s ad.
Exposure
One of the goals of advertising on the web is to accustom potential customers to a brand, so it makes sense that increased exposure to a specific brand can be an effective strategy to improve an ad’s performance.
For example, Retargeting, a popular method for increasing exposure, is known for “high click-through rates and increased conversions” as stated by Adroll, a leader in Retargeting. Your clients can greatly benefit from this strategy, so displaying the exposure levels of their ads is critical.
Engagement & Conversion Rates
The usefulness of Engagement and Conversion Rates stems from the precise data these metrics produce. As both of these metrics measure what percentage of users perform specific actions, there is little room for ambiguity when interpreting the resulting data.
Where Impressions provide an opportunity for estimating potential, Engagement and Conversion Rates are great for evaluating what actually occurs. This lets a client actively manage the performance of their ads, which is a great strategy.
Relevance Score
With numerous metrics that are vying for the attention of a client, large ad networks, run by companies like Google and Facebook, have created proprietary scoring systems that estimate an ad’s quality or relevance, giving a simple score between 1 and 10. While parts of these scoring algorithms are not public, it is known that metrics like Impressions, Engagement Rate, and Exposure are used, in part, to calculate Relevance Scores.
To reward highly relevant ads, platforms like Facebook use an ad’s Relevance Score to determine what a client pays to have their ad displayed, with a higher score resulting in a lower price.
This sophisticated metric can be a difference-maker for your AdTech platform.
Revenue
While impressions and engagements are useful in measuring the success of an ad campaign, it’s important to pair those metrics with how much revenue an ad is generating.
For many clients, the end goal is sales and other metrics are just part of the advertising process, so accurately listing revenue from an ad is very important.
Making it Happen
Ready to dive in? Request a demo of Keen and check out our full guide to get started with building your very own adroll dashboard for your clients.
Have questions about AdTech analytics?

This article was originally published March 2016 and was updated December 2019.


