About a week ago, I decided to update our status page again. Our previous version of the status page appeared to have slowly evolved into what looked like an EKG monitor. For our query durations it displayed frighteningly high peaks and sudden downward shifts. And yet, during these periods of seemingly abnormal behavior, we did not update our status page with any mention that our system was behaving abnormally. The reason: our status page was viciously lying misrepresenting data.
Our internal dashboards were displaying happy pictures while the status page displayed doom and gloom. I fixed this discrepancy, but in the interest of transparency and honesty, I’d like to discuss the changes I made to these figures and the motivations behind them.
There is a new display for extractions:
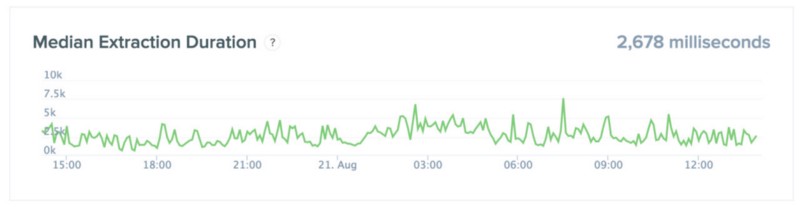
Extractions are requests for raw data stored with Keen IO. I am avoiding referring to them as queries because they have very different performance characteristics from queries such as counts or averages. Queries, as I am defining them, are answers to questions such as “How many customers made a purchase last month?” or “What was the average shipping cost of all purchases ordered from Canada during the month of July?” By contrast, extractions really only answer the question “Would you be so kind as to give me all of my data from the last week?”
Extractions will typically take longer to complete for a number of reasons and rarely relate to how long queries are performing at a given time. Thus, I created a separate display for them. This is displaying a line of samples of the median time to complete extractions. The upper-right hand corner displays an average (mean) of those samples over the past 24 hours. The extraction graph will typically be spiky because the usage pattern for extractions is different from queries. When someone wants a group of data, they typically request a lot of data at once in a burst and then cease asking for data.
The other big change was to the display labelled “Query Duration”, which has been renamed “Median Query Duration” and a number of changes have been made to the data that feeds it.
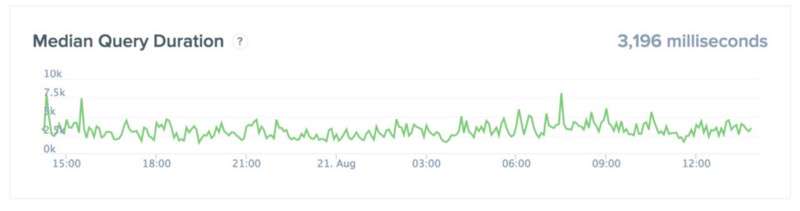
The first change was to remove the durations of failed queries. Queries can fail for a number of reasons. These failed queries have a strong tendency to have long reported durations. This drags up the graph to report higher query durations for the average case. I do not feel this is very helpful to those visiting the status page. My reasoning is that people with incorrectly configured setups do not represent the general users that are visiting the status page. For those users that are encountering errors, a status page that looks very healthy will help them recognize they are having an atypical experience and will then reach out to us or the community to get their issue resolved.
The second change to this display was to move the extractions out from the graph. Before, users running large extractions were shifting this curve upward, when in fact other queries were not impacted at all.
The final change is the most minor, and that was to switch from using a mean-based average to a median-based average. This change keeps extremely fast as well as extremely slow queries from influencing the graph as much. I believe the typical user’s situation as represented by a median is more relevant to viewers of our status page.
I hope this explanation is useful and, more importantly, I hope the new status page gives you more helpful information about the state of Keen IO’s systems.
(The following cat played only a minor role in writing this post.)