The Problem: Time to First Hello World
As developers, the faster the “Time to First Hello World” is, the better the experience. Whether you are a developer just learning how to code or have 20+ years of experience, the first “Hello World” with a new API, framework, or language is an amazing feeling.
When using custom analytics tools, it can take some time to setup analytics across your entire website. We wanted to help solve this problem.
The Solution: Auto-Collector Tracking & Dashboard
The Auto-Collector is a drop-in JavaScript tracking library that allows you to automatically begin collecting key site interactions like pageviews, clicks, and form submissions.
You can instantly get usage analytics like:
- How many people in Mexico visited your site last week compared to this week?
- What is your most popular page this month?
- How many pageviewers converted to filling out your contact form?
- Where are your pageviews being referred from? (Google, Twitter, internal link, another website, etc)
Today, I’m excited to share an instant user analytics dashboard for the Auto-Collector. It takes advantage of the existing event data models that the Auto-Collector uses.
When using the Auto-Collector Dashboard, you don’t have to think about what your data model is. It’s a great starting point to hit the ground running quickly, and of course you can always customize and enrich your data and your data views later.
How you can use it: Up and Running in 60 Seconds
- First, request a demo (unless you already have an account)
- If you don’t already have Auto-Collector installed, drop in this snippet(with your
PROJECT_IDandWRITE_KEY)into your website’s<head>code and start seeing web events flow in within seconds. - Next, if you go to this link, you can “remix” the dashboard to create your own version. All you need to do is insert your
PROJECT_IDandREAD_KEYfrom your existing Keen IO project that has data streaming to it from the Auto-Collector.
By the way, I used Glitch, a free collaborative code editor and hosting system, because it’s amazing and you can have a working dashboard in seconds. It’s also helpful for running experiments and trying out new technologies. The team at Fog Creek Software, who built Glitch, are super helpful and awesome humans.

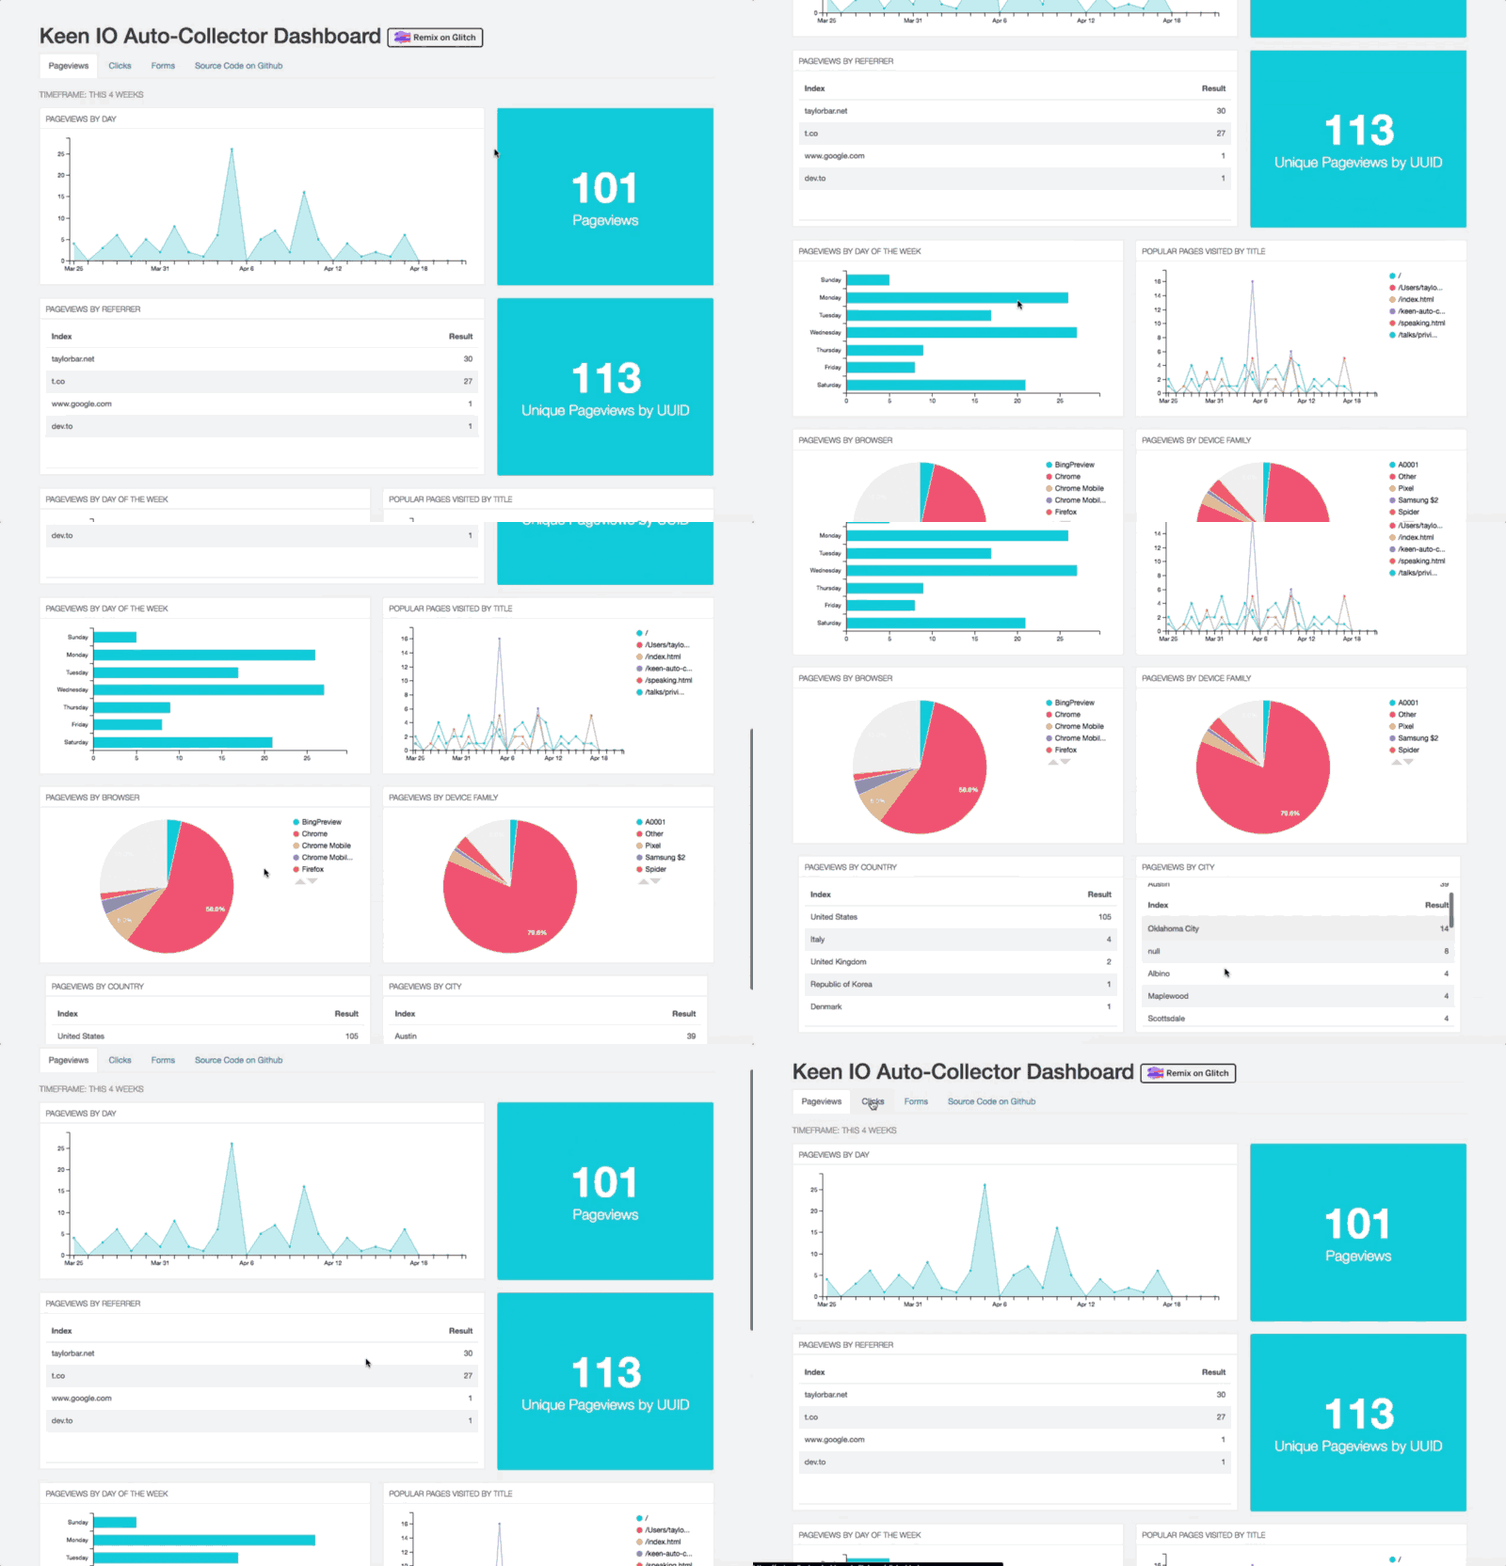
This is just one tab of the dashboard. There are two more!
You can see an example dashboard right now running on Glitch because I have included an example Project ID and Read Key in the project.
You can also check out the code on Github here. If you like it, please give it a star! 🌟 I’ve also included instructions there to help you run the dashboard locally if Glitch isn’t your thing.
Conclusion
This is just one way to build a user analytics dashboard with Keen. There are tons of awesome things that can be done with this data and the Keen Dataviz Library. If you want to track custom events beyond pageviews, clicks, and form submissions, you can easily access our core Tracking Library, which this SDK uses under the hood, to send custom events to Keen.
The data collected by the Auto-Collector nicely compliments other user behavior data, like signups, logins, purchases, powerups, upgrades, errors, swipes, favorites, impressions, etc.
We’d love your suggestions, feedback, bug reports, stars, and other contributions in the Github repo. We’ve been known to send out some fun swag for contributions of all sizes. *wink wink*

I’d love to hear what you think about it and what we can build next to help you try out Keen in response below. Happy hacking!


