Keen’s stunning revamped Data Visualization Library is finally here! It’s easier than ever to transform your data into clean visualizations and quickly draw actionable insights.
What is the Keen revamped data visualization library?
When we set out to update the Keen data visualization library we had a few key goals in mind. We wanted it to have: high accessibility, flexibility in use, and best-in-class presentations.
High Accessibility
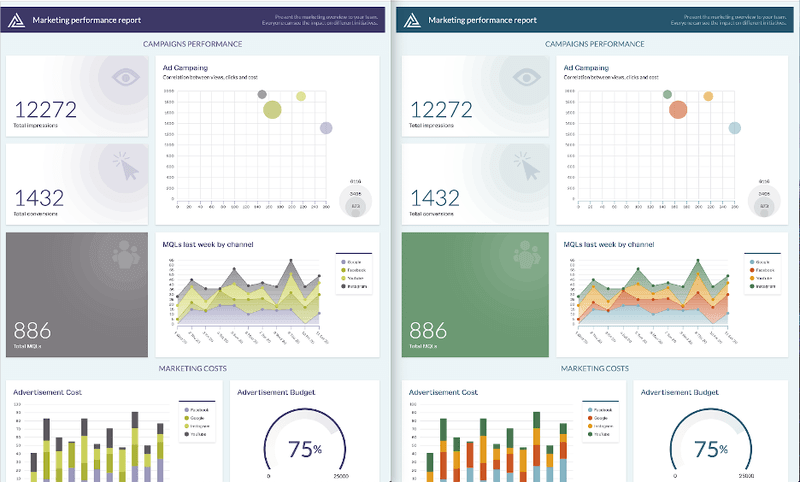
First and foremost, we wanted to create a product that was accessible to everyone and could be easily consumed for identifying relevant data trends. We began by carefully selecting a color palette to ensure readability for all users – including those with different types of color-blindness. Below, you can see how the color palette appears for people with deuteranopia (unable to perceive green) with our example marketing dashboard:
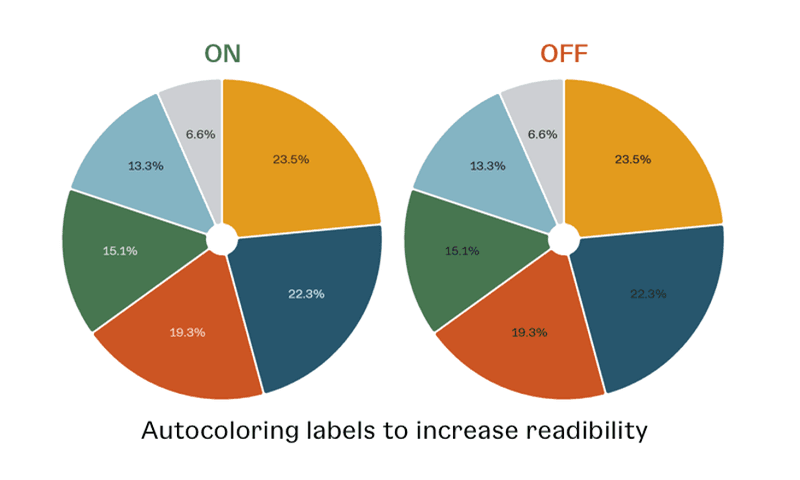
Next, we introduced automation in terms of label colors to ensure proper contrast. Our auto-color feature ensures that your visualizations will utilize the optimal text colors for maximum readability. You can see the feature in action below.
Flexibility in use
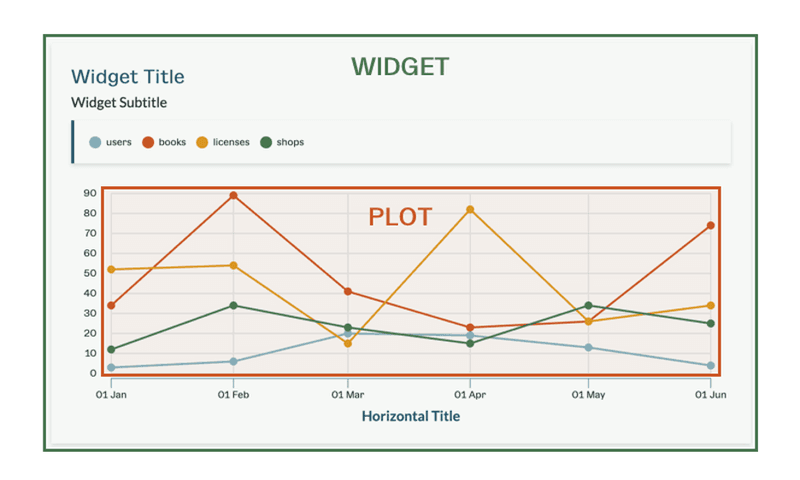
In addition to our standard color palette, it was critical that we create a product that was highly flexible and offered visualizations that could be fully customized to be consistent with your brand and platform design. Our charts can be used independently or with whatever widgets (legend, title, axes, axes titles, grid components) are needed.
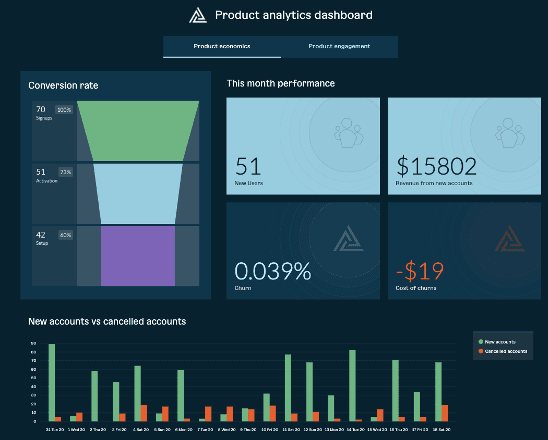
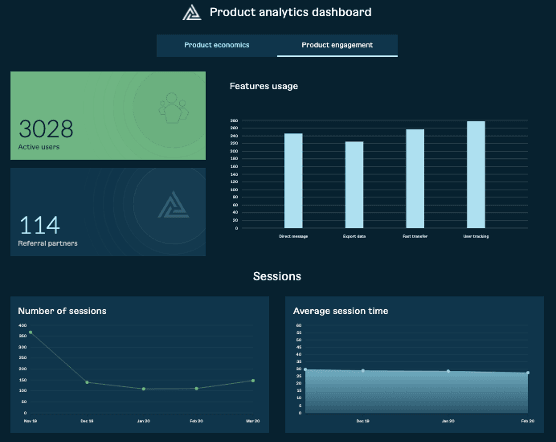
To highlight the flexibility of the new Keen data visualization library, we’ve created a couple of example dashboards for a product analytics and IoT use case.
The product analytics dashboard uses a dark theme and gives you an idea of the potential for styling chart backgrounds or removing the card element completely. It also incorporates different color elements for the charts and widgets.
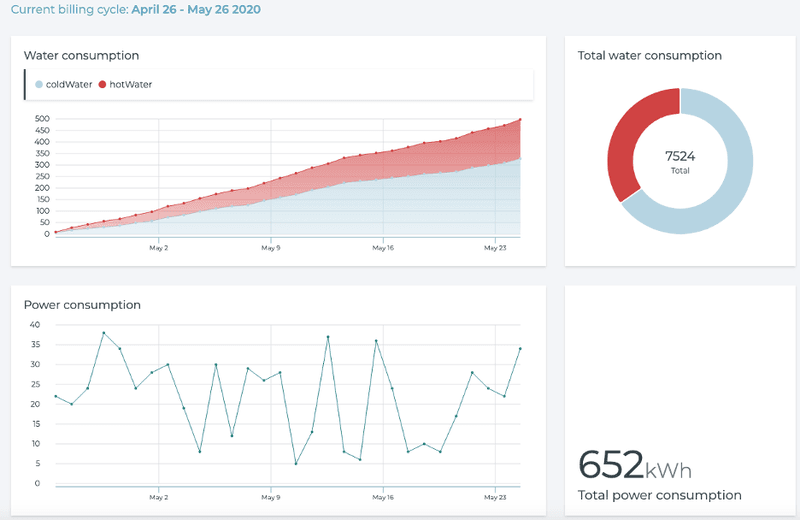
The IoT dashboard demonstrates the library flexibility by adjusting fonts to match your platform style, using relevant colors to improve chart readability (for example red for hot water, blue for cold), and varying widget sizes to achieve the desired dashboard look and feel.
Best-in-class Presentation
Delivering a library with best-in-class data presentation was a must. The revamped Keen Data Visualization offers smooth, interactive animations, improved chart features, and a new chart type, the bubble chart.
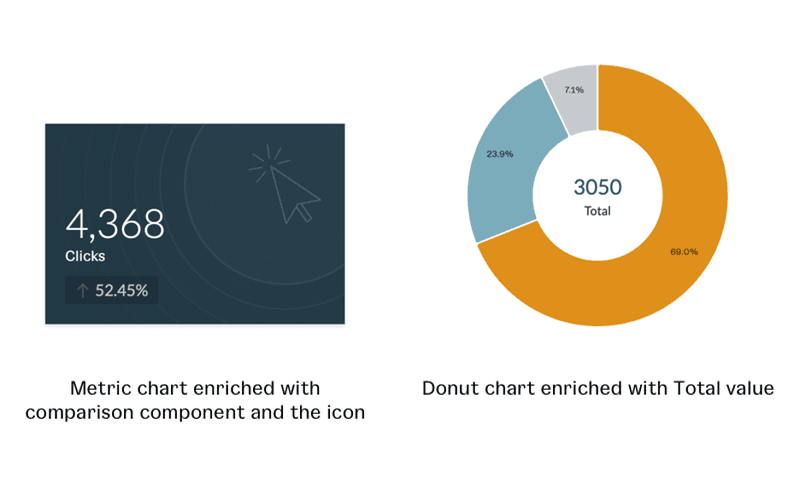
A few chart features to highlight are:
- Expanded metric chart options: additional icon, comparison component
- Pie + Donut chart – ‘Others’ slice that automatically combine slices below a given percentage so you do not have to worry about less relevant data
- Donut chart – ‘Total’ component that displays the sum of all slices
Why did we choose to create our own data visualization library?
We tried other solutions for data visualization, however, each of them were missing things that were important from our perspective. When we started this project – our main assumptions were:
- Deliver re-usable and customizable building blocks
- Provide the optimal experience for developers and visualization users
- Leverage the Keen API in the best way
- Make data visualization fast, fun and easy
We wanted our visualizations to be simple and clean in form so that they help our users transform data into insights that matter. The words of Edward Tufte well describe what was top of mind when we were creating our dashboard components,
“There is no such thing as information overload. There is only bad design.”
What technology did we use to develop the new data visualization library?
The core of new visualizations is based on four popular libraries:
- React – for leveraging the power of components composition and providing high-performance reusable building blocks
- D3 – to provide efficient mathematical calculations
- Styled-components – to allow users to define their own theme for most of the visualization components
- Framer-motion – for creating stunning animations
Ways to use the new data visualization library?
Keen’s new data visualization library is designed to seamlessly connect the data you collect and query using the Keen API with your visualizations, no additional parsing, and transformations required. You can then easily embed our dashboards and charts into your website or application. To get started, you can watch this 2-minute video tutorial or install our new data visualization library.
How to migrate from old visualizations to new visualization?
Migrating from the old visualization library to the new visualization library is quick and easy. Watch this 1-minute video tutorial to get started.
Summary
Keen’s Revamped Data Visualization Library is accessible for everyone, flexible in design, and offers best-in-class charting. Get started for free and learn more about using our Data Visualization library in our docs.


