Build sleek, interactive dashboards and easily share them with relevant stakeholders using our new Dashboard Creator.
What is the Dashboard Creator?
The Dashboard Creator is a drag-and-drop tool that enables you to quickly create reports and share them with relevant internal or external users. It seamlessly integrates with the Saved Queries API and the Keen Data Visualization Library, allowing you to create and present custom analytics in minutes, not months. Existing dashboards have been migrated to the new dashboard creator, so you can continue business as usual.

Why did we develop the Dashboard Creator?
Our new Dashboard Creator was developed to enhance dashboard interactivity, categorization, theming, and efficiency. We’ve added heaps of new functionality to address this including: filter and date range widgets, tagging, cloning, advanced chart configuration, and advanced theming. The design and user experience have also been completely revamped. We cover the enhancements in more detail below.
What new features have been added to the Dashboard Creator?
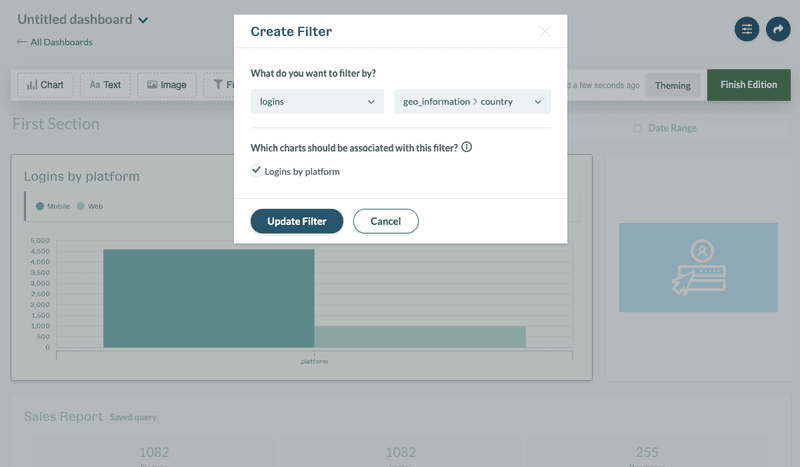
Filter Widget
Filter widgets temporarily modify all associated charts by applying the selected filters. This enables you and stakeholders the dashboard is shared with to quickly isolate relevant segments of data at the dashboard level.
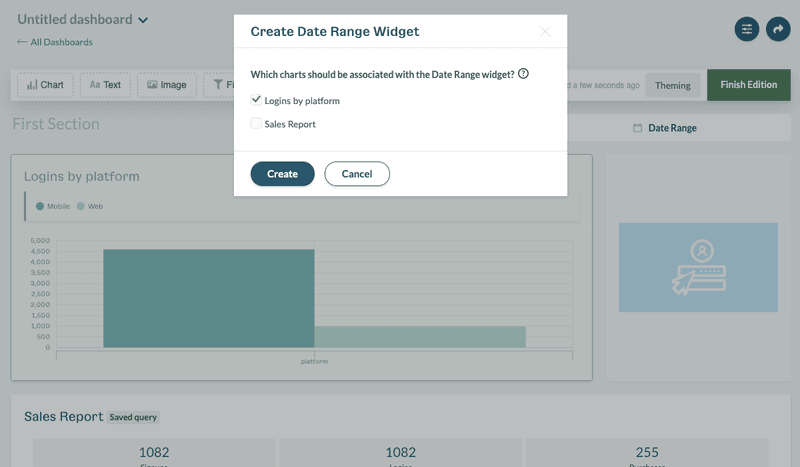
Date Range Widget
Date Range widgets temporarily modify the timeframe for all associated charts. This allows you and stakeholders the dashboard is shared with to easily adjust the time period at the dashboard level.
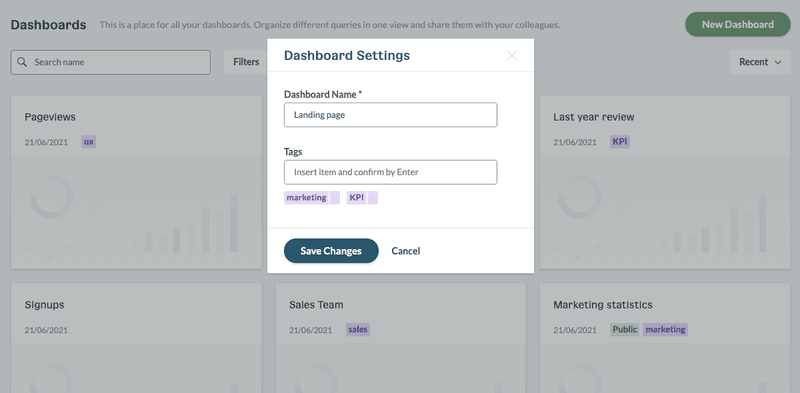
Dashboard Tagging
Tags enable you to provide context around the data presented in a dashboard and quickly filter down to the dashboards that are most relevant. We recommend adding a tag for your personal dashboards. This is a great way to stay organized when collaborating with your team.
Dashboard Cloning
Dashboards can now be cloned enabling you to efficiently create a new dashboard and then apply the necessary edits.
What improvements have been added to the Dashboard Creator?
Design and User Experience
The Dashboard Creator has been redesigned to give you more real estate to build shareable dashboards, additional functionality to improve chart interactivity, and a modern data visualization library that cleanly presents insights. We’ve also enhanced the dashboard management by adding buttons to perform dashboard actions (e.g clone, share, delete) and adjust dashboard configuration (e.g. naming and tagging) in the dashboard list view.
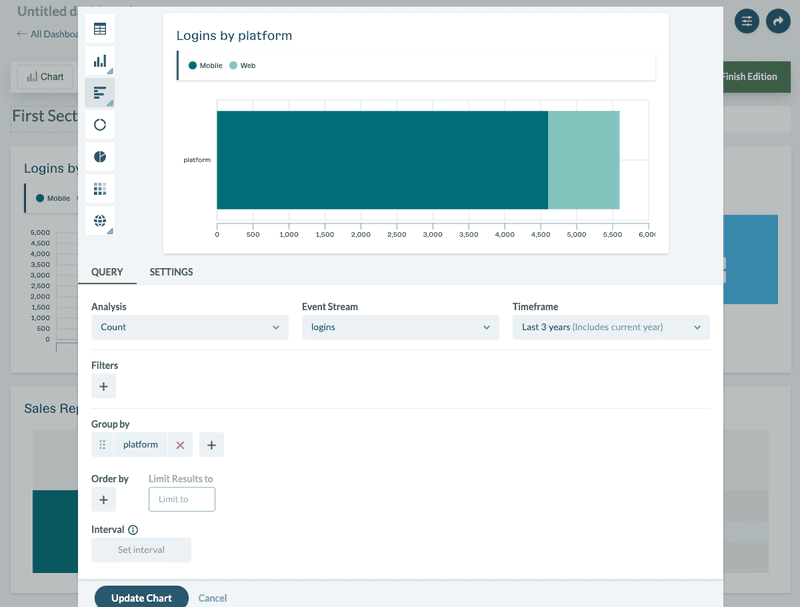
Advanced Chart Configuration
Charts can now be edited directly within the Dashboard Creator—no more shuffling between views. You also now have the ability to create ad-hoc queries that will only exist for a specific dashboard. This enables you to create metrics for a single dashboard and isolate metrics from the Data Explorer.
Advanced Chart Styling
Chart styling has been enhanced with new theming capabilities allowing you to create stunning, easy-to-understand dashboards that are aligned with your brand. You can add your color palette and fonts for visual consistency. Also, customize chart spacing, margins, corner rounding, and drop shadows to match your product’s look and feel.

Summary
The Dashboard Creator enables you to easily create interactive dashboards that are consistent with your brand. Then, seamlessly share these dashboards with key stakeholders, so they can uncover the actionable insights they need.
Ready to see the Dashboard Creator in action? Sign up for a 30-Day Free Trial to get started today. Happy Visualizing!


