Having an email marketing strategy is critical for any modern business. Email marketing enables companies of all sizes to nurture leads with relevant content offers, provide onboarding help to new users, and stay engaged with their customers in a completely automated fashion. With such a powerful, far-reaching medium, tracking performance and optimizing strategy is a must.
To help solve this, Keen, together with SendGrid, created an integration that sends all of your SendGrid email event data to Keen. From there, your data will be stored forever and you’ll get flexible analytics tools to drill down into email performance and create stunning email marketing dashboards. Haven’t started streaming your SendGrid data to Keen yet? Setting up the integration only takes a couple of minutes and we offer a handy, step-by-step walkthrough to help get you up and running.
In this guide, we will be showing you how to build an email marketing dashboard in Keen with the following 8 email metrics you should be tracking in 2020 so that you can start identifying actionable insights and refining your email marketing strategy.
You can also follow this video guide to create your email marketing dashboard!
- Deliverability Rate
- Open Rate
- Mobile Open Rate
- Click-Through Rate
- Conversion Rate
- Count of Link Clicks by Campaign
- Bounce Rate
- Unsubscribe rate
Creating queries for your 8 email metrics
Keen’s Data Explorer allows you to perform a variety of analyses on your data by running queries. A query can be run one-off to uncover a specific insight or can be saved and easily re-run whenever you need. After you’ve saved multiple queries, you can use our Dashboard Creator to seamlessly present your queries in all in one place..
To create a query, navigate to the Explorer tab in the Keen app. From there, you will select the event collection you want to analyze, the analysis type you’d like to perform, and the relevant query parameters such as timeframe, filters, grouping, and ordering.
1. Deliverability Rate
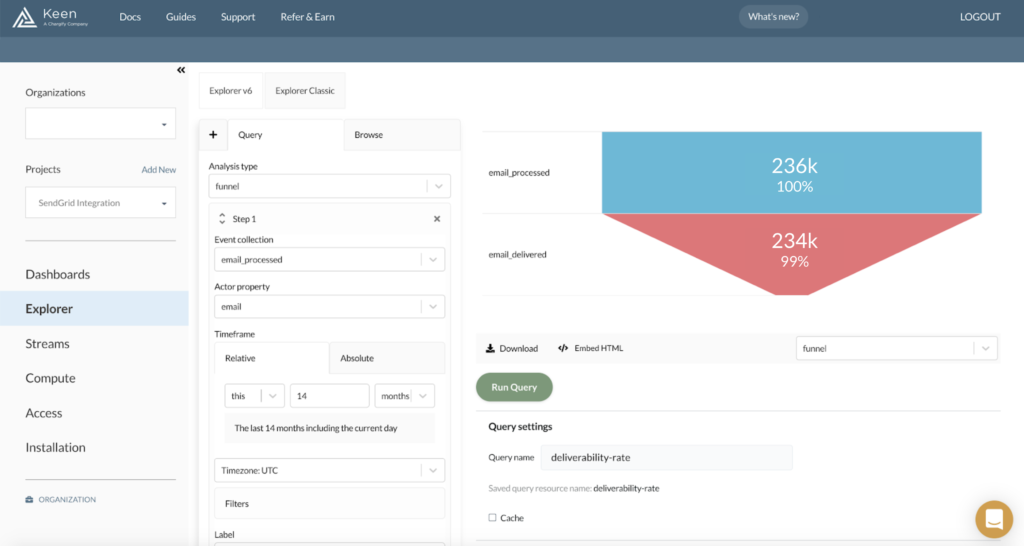
Making sure that your emails are making it to their intended audience is an important metric to track. To create this query in Keen:
-
- Set the analysis type to
funnel - Set the event collection to
email_processed - Set the actor property to
email(this will be used to track a user through the funnel) - Select add step, set the event collection to
email_delivered, and set the actor property toemail - Select a timeframe
- Optional: Select filters. (Pro tip: Use the
categoryproperty to segment by campaign andsinglesend_nameormessage_idproperty to segment by a particular email.) - Select Run query
- Select the funnel visualization in the right-hand dropdown under the chart
- Save your query so that you can use it to create an email marketing dashboard later
- Set the analysis type to
2. Open Rate

Measuring your marketing email open rate is a great way to understand how your subject lines and preview texts are resonating with your subscribers.
-
- Go to the browse tab in the Explorer
- Select your saved Deliverability rate query
- Select Clone, give your query a new name, and select save
- Navigate to the query tab in your cloned query
- Change the event collection to
email_deliveredfor step 1 andemail_openfor step 2 - Set the Actor property to
emailfor both steps - Select a timeframe and filters
- Select Run query and then select Update to save your changes
3. Mobile Open Rate

Now that you have insight into what your open rates look like overall, it’s valuable to dive a little deeper into how specific segments are performing. Keen offers all kinds of data on your subscribers so you can look at opens by device type, geographic location, and more.
-
- Repeat steps 1-4 as above to clone your saved Open Rate query
- Select a timeframe
- Select filter and then click add filter
- Select the target property as
useragent.device.typeand select contains for the comparison - Type “Mobile” in the field and then hit done (This will filter the data for only users that have a device type with the word mobile)
- Select run query and then update to save your changes
4. Click Through Rate (CTR)

Getting your subscribers to open your email is a huge accomplishment! But do they find the content you are sharing engaging? You’ll be able to track this by looking at click-through rates, the ratio of clicks to opens.
-
- Select the plus sign to add a new query
- Set the analysis type to
funnel, set the event collection toemail_open, and set the actor property toemail - Select add step, set the event collections to
email_click, and set the actor properties toemail - Select a timeframe and filters
- Run and save query
5. Conversion Rate

How many of your subscribers received the email blast for your new content pillar page and then clicked the link to check it out? You’ll be able to answer this question by monitoring your conversion rates.
-
- Select the plus sign to add a new query
- Set the analysis type to
funnel, set the event collection to the property you would like to use as a conversion rate benchmark (we recommendemail_delivered) and set the actor property to email. - Select add step, set the event collections to
email_click, and set the actor properties toemail - Select a timeframe and filters
- Run and save query
6. Count of Link Clicks by Campaign

Measuring a count of link clicks grouped by campaign or email name is a great way to understand which types of content delights your subscribers.
-
- Select the plus sign to add a new query
- Set the analysis type to
count(orcount_uniqueif you don’t want to count the same user multiple times.) - If doing a
count_unique, set the target property toemail. - Select a timeframe
- Set the group by target property as category
- Set the order by as ASC or DESC
- Run and save query
7. Bounce Rates

Making sure that you have a healthy email list and minimizing your bounce rates are great ways to maintain a high sender score. Thus, ensuring your content reaches your audience and avoids their spam folder.
-
- Select the plus sign to add a new query
- Set the analysis type to
funnel, set the event collection toemail_processed, and set the actor property toemail - Select add step, set the event collection to
email_bounce, and set the actor property toemail - Select a timeframe and filters
- Run and save query
8. Unsubscribe Rates

Keep an eye on those unsubscribes to measure both if your content is hitting the mark and if you are reaching the right audience.
-
- Select the plus sign to add a new query
- Set the analysis type to
funnel, set the event collection toemail_deliveredand set the actor property toemail - Select add step, set the event collection to
email_unsubscribe, and set the actor property toemail - Select a timeframe and filters
- Run and save query
Creating your email marketing dashboard

Now that you’ve created your 8 email marketing metrics, the next step is to navigate to the Dashboards tab in the Keen app and add your saved queries to a dashboard. To do this:
- Select new dashboard
- Hover over add item and drag the chart type onto the Dashboard
- In the right hand ribbon, select the saved query
- Adjust the chart appearance and settings with the chart options menu in the right hand ribbon
- Repeat for desired number of charts
- When finished, select save
- Access your dashboard locally or share with others using a shareable link
Embedding your email marketing dashboard
Voila! You should now have an email analytics dashboard with 8 key metrics that every email marketer should be tracking. Many SendGrid users find it useful to embed these email analytics into a report if they need to share the results with a client. Here’s a link to our Customer Facing Analytics Guide that will give you step-by-step instructions on how to embed your SendGrid analytics into your product. You can also grab a shareable link in the Dashboard Creator.
Happy optimizing!


