You’re not going to settle for an average business. You’re swinging for the fences. You’re building towards a data driven business and taking the time to ask the right questions. Is this level I’ve designed too hard? Are customers’ shopping carts full enough to make this sustainable? Are viewers making it to the end of the video? How long does it take for the tractor to traverse the vine rows? Do people check their smartwatch right after receiving a notification?
The average approach to answering questions like this is, well, average. Keep it simple, sum the event property and divide by the number of occurrences. Powerful. Intuitive. But as your business grows and your reach expands, nefarious outliers creep in. Analytical gremlins, easy yet dangerous to ignore.
In gaming, the initial experience of the player is of paramount importance. If the first level takes too long, feels too hard, and doesn’t provide the right sense of reward… the majority of gamers won’t have the patience to stick around. If the average level_1_completed.duration is too high, your deep seated urge to prove your 3rd grade teacher wrong will drive you to lower the duration. But after making changes, all your reviews complain about “kid gloves” and “railroading” and “shallow gameplay”. What happened?
Toby happened. Toby got in to your beta somehow, probably by lying about system specs. Toby tried your game and started the tutorial. Toby, are you there? Toby, pls respond.

Toby took fifteen hours to finish the introduction to your lovingly crafted game. Everyone else took less than fifteen minutes. Did Toby fall asleep? Is Toby a dog? Why is he wearing a tie? We don’t know, there’s no event data for that. But Toby alone skewed your average metric and this is why we can’t have nice things, Toby. Perhaps we should applaud his perseverance for eventually making it through, but he’s going to wag his tail either way so the business comes first.
Simple statistical incantations can help you ignore Toby and focus on the customers you care about. Calculating the median is a small change that can have a major impact on your analysis. By keeping a sorted list of all values and using the midpoint of your dataset, rather than the average, you can get a more valuable metric. If the median level_1_completed.duration is 11 minutes, half of your players finished faster and half finished slower (including Toby).
Percentile Analysis

The median is much more helpful, but surely you want to design for more than half of your customers! By calculating the 75th percentile, you’ll be able to evaluate the difficulty for three quarters of the players. With multiple percentiles together, you can examine the distribution and more easily identify that not only did Toby take 10x longer than 99.9 percent of your population, but there’s a 2x jump from the 10th percentile (hardcore gamers) and the 40th through 60th (midcore, your target market).
Level 1 Completed Duration
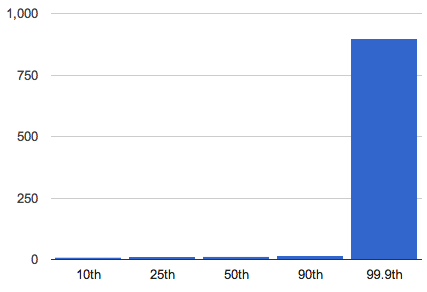
Maybe he took a long break to learn to tie his tie?
Level 1 Completed Duration — #NoToby
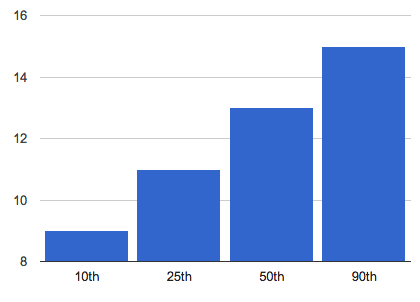
Good boy!
As mothers often suggest, let’s think about something other video games. You can start to get fancy once you have a sense of your historical percentile distribution. By using your past measurements as thresholds, you can intelligently react to significant changes. Perhaps you need to reprovision when your memory utilization passes above the 99th percentile of last month’s’ performance. Or alter your purchase strategy when your ad bid prices deviate. You probably shouldn’t use it to stack rank your employees based on lines of code, though.
Percentile Analysis at Scale
One reason percentile analysis isn’t more common is that simple naive calculation is not scalable. Keeping a sorted list of all values gets computationally expensive. At high cardinality, this approach is a server-smotherer.

Fortunately, this has been an active body of academic research for years and there are several state of the art algorithms for efficient quantile determination. When your dataset is too large for naive computation, you must face the tradeoff of speed, efficiency, and accuracy. By accepting a certain approximate error rate, you can determine your answer even at great scale.
TDigest is one of the latest entries that offers a desirable combination of speed, resource consumption, and definable approximate error. TDigest has several major advantages over alternative algorithms; QDigest does not support floating point values, CKMS does not easily support merges that are essential for map/reduce style operations.
Percentile Analysis with Keen IO
These reasons are why we chose TDigest to be the core of our new Percentile analysis feature, complete with Median syntactic sugar. Now with simple API calls, you can make sure the Tobies of the world never throw off your analysis again!
https://api.keen.io/3.0/projects/<project_id>/queries/median?
    api_key=<read_key>&
    event_collection=<event_collection>&
    target_property=<property_name>

https://api.keen.io/3.0/projects/<project_id>/queries/percentile?
    api_key=<read_key>&
    event_collection=<event_collection>&
    target_property=<property_name>&
    percentile=<percentile>
So, how can Percentile analysis help make your business more than average? Dive in, let us know, and stay tuned for recipes!


