
Our buddies at Kickfolio created a lovely way to run your fully native iPhone app in the browser. Their site makes it super easy for an app developer to upload an iPhone app and collect feedback from users across the web. Let’s dig into how they integrated with Keen IO to collect and share analytics with their customers.
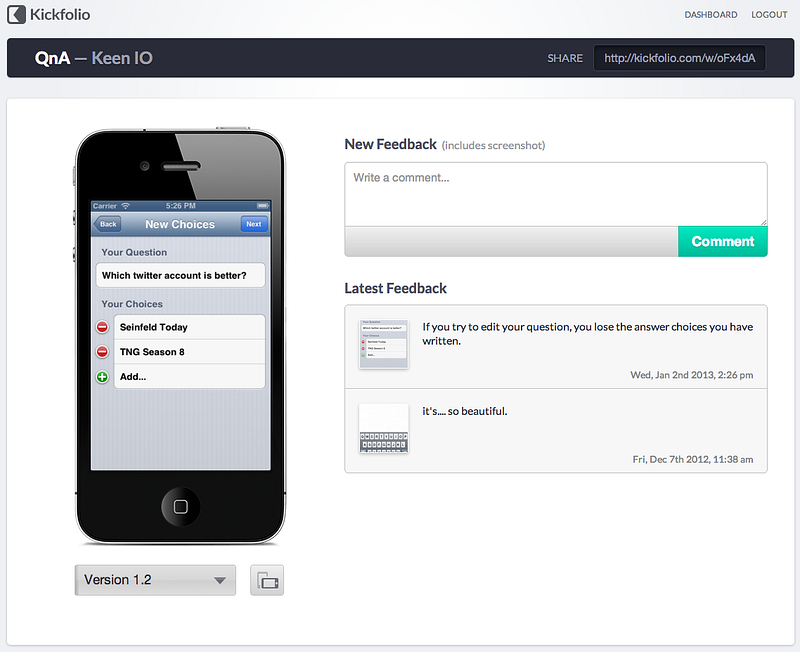
Screenshot: Test out an iPhone app in your browser using Kickfolio
Kickfolio uses Keen IO to track each time someone loads an app (e.g. the iPhone app you see in the screenshot).
This information is useful for an app developer; they want to know how many times the app they uploaded has been reviewed. To share this information with the app makers, Kickfolio created a dashboard tab. Now each of Kickfolio’s customers can see how many times their app has been viewed using Kickfolio.
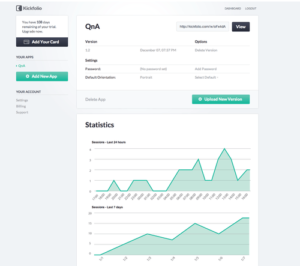
Screenshot: Keen IO charts embedded in Kickfolio’s user dashboards
How did they do it?
Kickfolio used the Keen IO JavaScript client to record whenever a user engages with their app preview feature. An event is sent to their “connect” event collection for each session.
Here’s what Kickfolio’s data model looks like for a “connect” event.
{
   "keen": {
       "created_at": "2013-01-03T23:37:41.768000+00:00",
       "timestamp": "2013-01-03T23:37:41.768000+00:00"
   },
   "app": {
       "publicKey": "iMaUniQueKeY",
       "url": "https://www.filepicker.io/api/file/aBcDefGhiJ"
   },
   "referrer": "http://myapplaunchpage.com",
   "sessionId": "soicdBssoieHHfsd",
   "userAgent": {
       "string": "Mozilla/5.0 (Macintosh; Intel Mac OS X 10_7_4) AppleWebKit/537.11 (KHTML, like Gecko) Chrome/23.0.1271.101 Safari/537.11"
   }
}
Notice the event contains an event property called “app.publicKey”. Each customer application uploaded to Kickfolio has a unique “publicKey”. This identifier allows Kickfolio to filter analytics for a specific app. In fact, the app.publicKey property is the only property required for this use case. The rest of these properties are being recorded for potential future use.
As shown in the screenshot above, Kickfolio provides an engagement dashboard for each of their customers. Those charts are drawn using the Keen IO JavaScript library. The logic used for the analysis is extremely simple: count the number of “connect” events with a given “app.publicKey”. Using series, we can chart the number of sessions over the past month, past 7 days, and past 24 hours (or any time period).
Want to see more? Here’s the code Kickfolio used to generate their graphs. In it, you can see how they applied a filter to count the number of sessions for a specific app.publicKey.
If you have any questions about how this works, let me know!
– Michelle (@michellewetzler)
PS: I had the pleasure of talking to Ed, Kickfolio’s developer/CEO last week. I asked him to share his thoughts on the integration process. He surprised me when he brought up our chat room, users.keen.io. “The best part was the Keen IO user chat. Your docs are excellent, but being able to ask questions directly to the team was huge. Another one of our service providers took 60 hours to respond to an integration question! That’s a big deal for us.”
This re-affirms our suspicions: building a great API is as much about people as it is about code. We’re here to help!


