Getting visitors to a website used to be as easy as loading a bunch of written content, and filling it with keywords that would drive hundreds, if not thousands of visitors from the search engines to your digital front door. Unfortunately, these days you can’t just build a website and expect visitors will come. Now, more than ever, publishers must rely on data-driven insights in order to yield more traffic.
This can mean things like optimizing headlines with the keywords people are searching for online to rank better in search engines, refining metadata so search engines understand better what is in their content, updating content with higher quality keywords, optimizing images with keyword-rich alternative text, and much more. However, it doesn’t stop there. Publishers also need to rely on content analytics to determine which posts and pages are getting the most traction.
More important than simply having the content analytics at hand, is that there is also a need for understanding the content metrics that give them the data in the first place. This does a few things for a publisher. First, good content analytics yields better readership. Using the data-driven insights, they can get a better understanding of what their audiences want and who they are, so they can deliver the content they want to read.
Content analytics derived from various content metrics also tells potential advertising customers how the online publication is performing. When there is better readership, there are more opportunities for things like sponsored content, banner ads, link ads, and more. The data you collect is a wonderful and easy way to show value to your potential sponsors, advertisers, and brand partners.
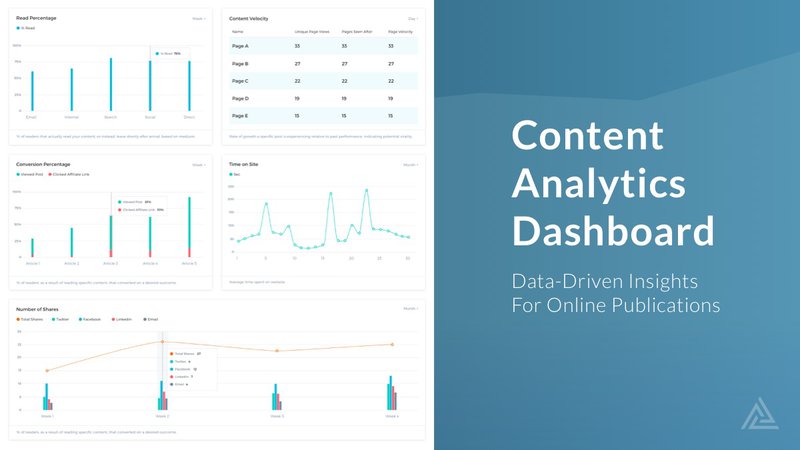
The not-so-secret secret to success is to create in-house customer-facing dashboards of content analytics that display real-time data related to usage and performance in a way that is actionable. This information then tells editorial and content teams, as well as sales and marketing teams, how to improve the content that will be displayed on their websites to enhance the reader experience.
Can You Relate?
What is the Goal of Content Analytics?
The goal of a customer-facing content analytics dashboard is to understand audiences, inventory, and brand performance. From your marketing and sales team to the staff in your newsroom/editorial department, everyone will be more successful when you understand what’s driving value for your readers.
You also want to show true engagement beyond the page views. It’s not enough to know people showed up to the page. You need data-driven insights that can help you make better content creation decisions. Thanks to modern content analytics tools, you can track any type of web or mobile engagement with your content, whether it’s an article, a video, a survey, an app, or something totally new.
The ultimate goal for an online publisher is typically to earn a healthy revenue, and the secret sauce to achieving that income lies in delivering the best reader experience possible. A better reader experience translates into positive data showing potential advertisers and sponsors just how valuable your brand is. Your sales teams need to be able to share solid numbers and data that clearly depict your online publication is a winning bet for their advertising dollars.
In other words, potential sponsors and advertisers want to know that if they pay for content or banners ads on your page, their ads will actually have a chance of being seen and clicked. The more page views you are getting, and the more engaged your audience is with your content, the easier it will be for your sales team to pitch advertising purchases. Therefore, you need to get to know your visitors, learn who they are, and how, when, and what they are reading and sharing. What content is performing best, worst, or not at all?
It’s about more than tracking how many views your website got in a month. To get a clear image of whether or not your page is doing its job, you need to measure the time spent on each page, how far the reader scrolled down through the article before bouncing to another story or away from the page completely, and how many articles they read. Finally, you need to understand your reach across platforms such as Facebook, Twitter, and other social media outlets, to determine what makes a reader most likely to share your stories to further your brand’s recognition.
Content Analytics in Real-Time
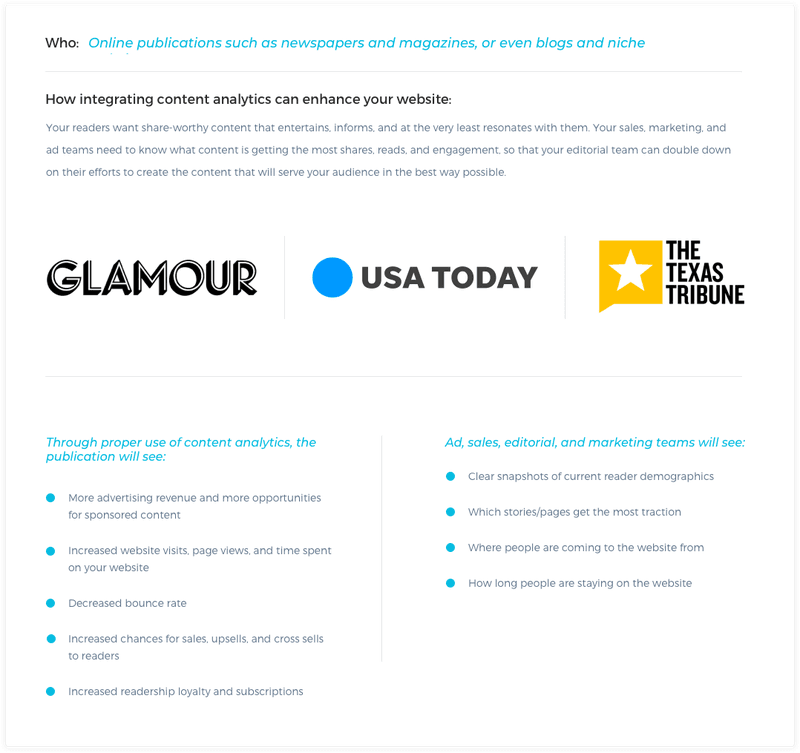
Whether you are a national publication, a state dedicated news outlet, a trendy lifestyle magazine, or even a blog, it’s what’s inside that counts. That is, what’s inside your website, and what the analytics of your website look like.
What makes for a good reader experience, and is the reader who ultimately lands on your page having one? To help determine if your readers are having a good reader experience, publishers need to focus on a minimum of the following metrics:
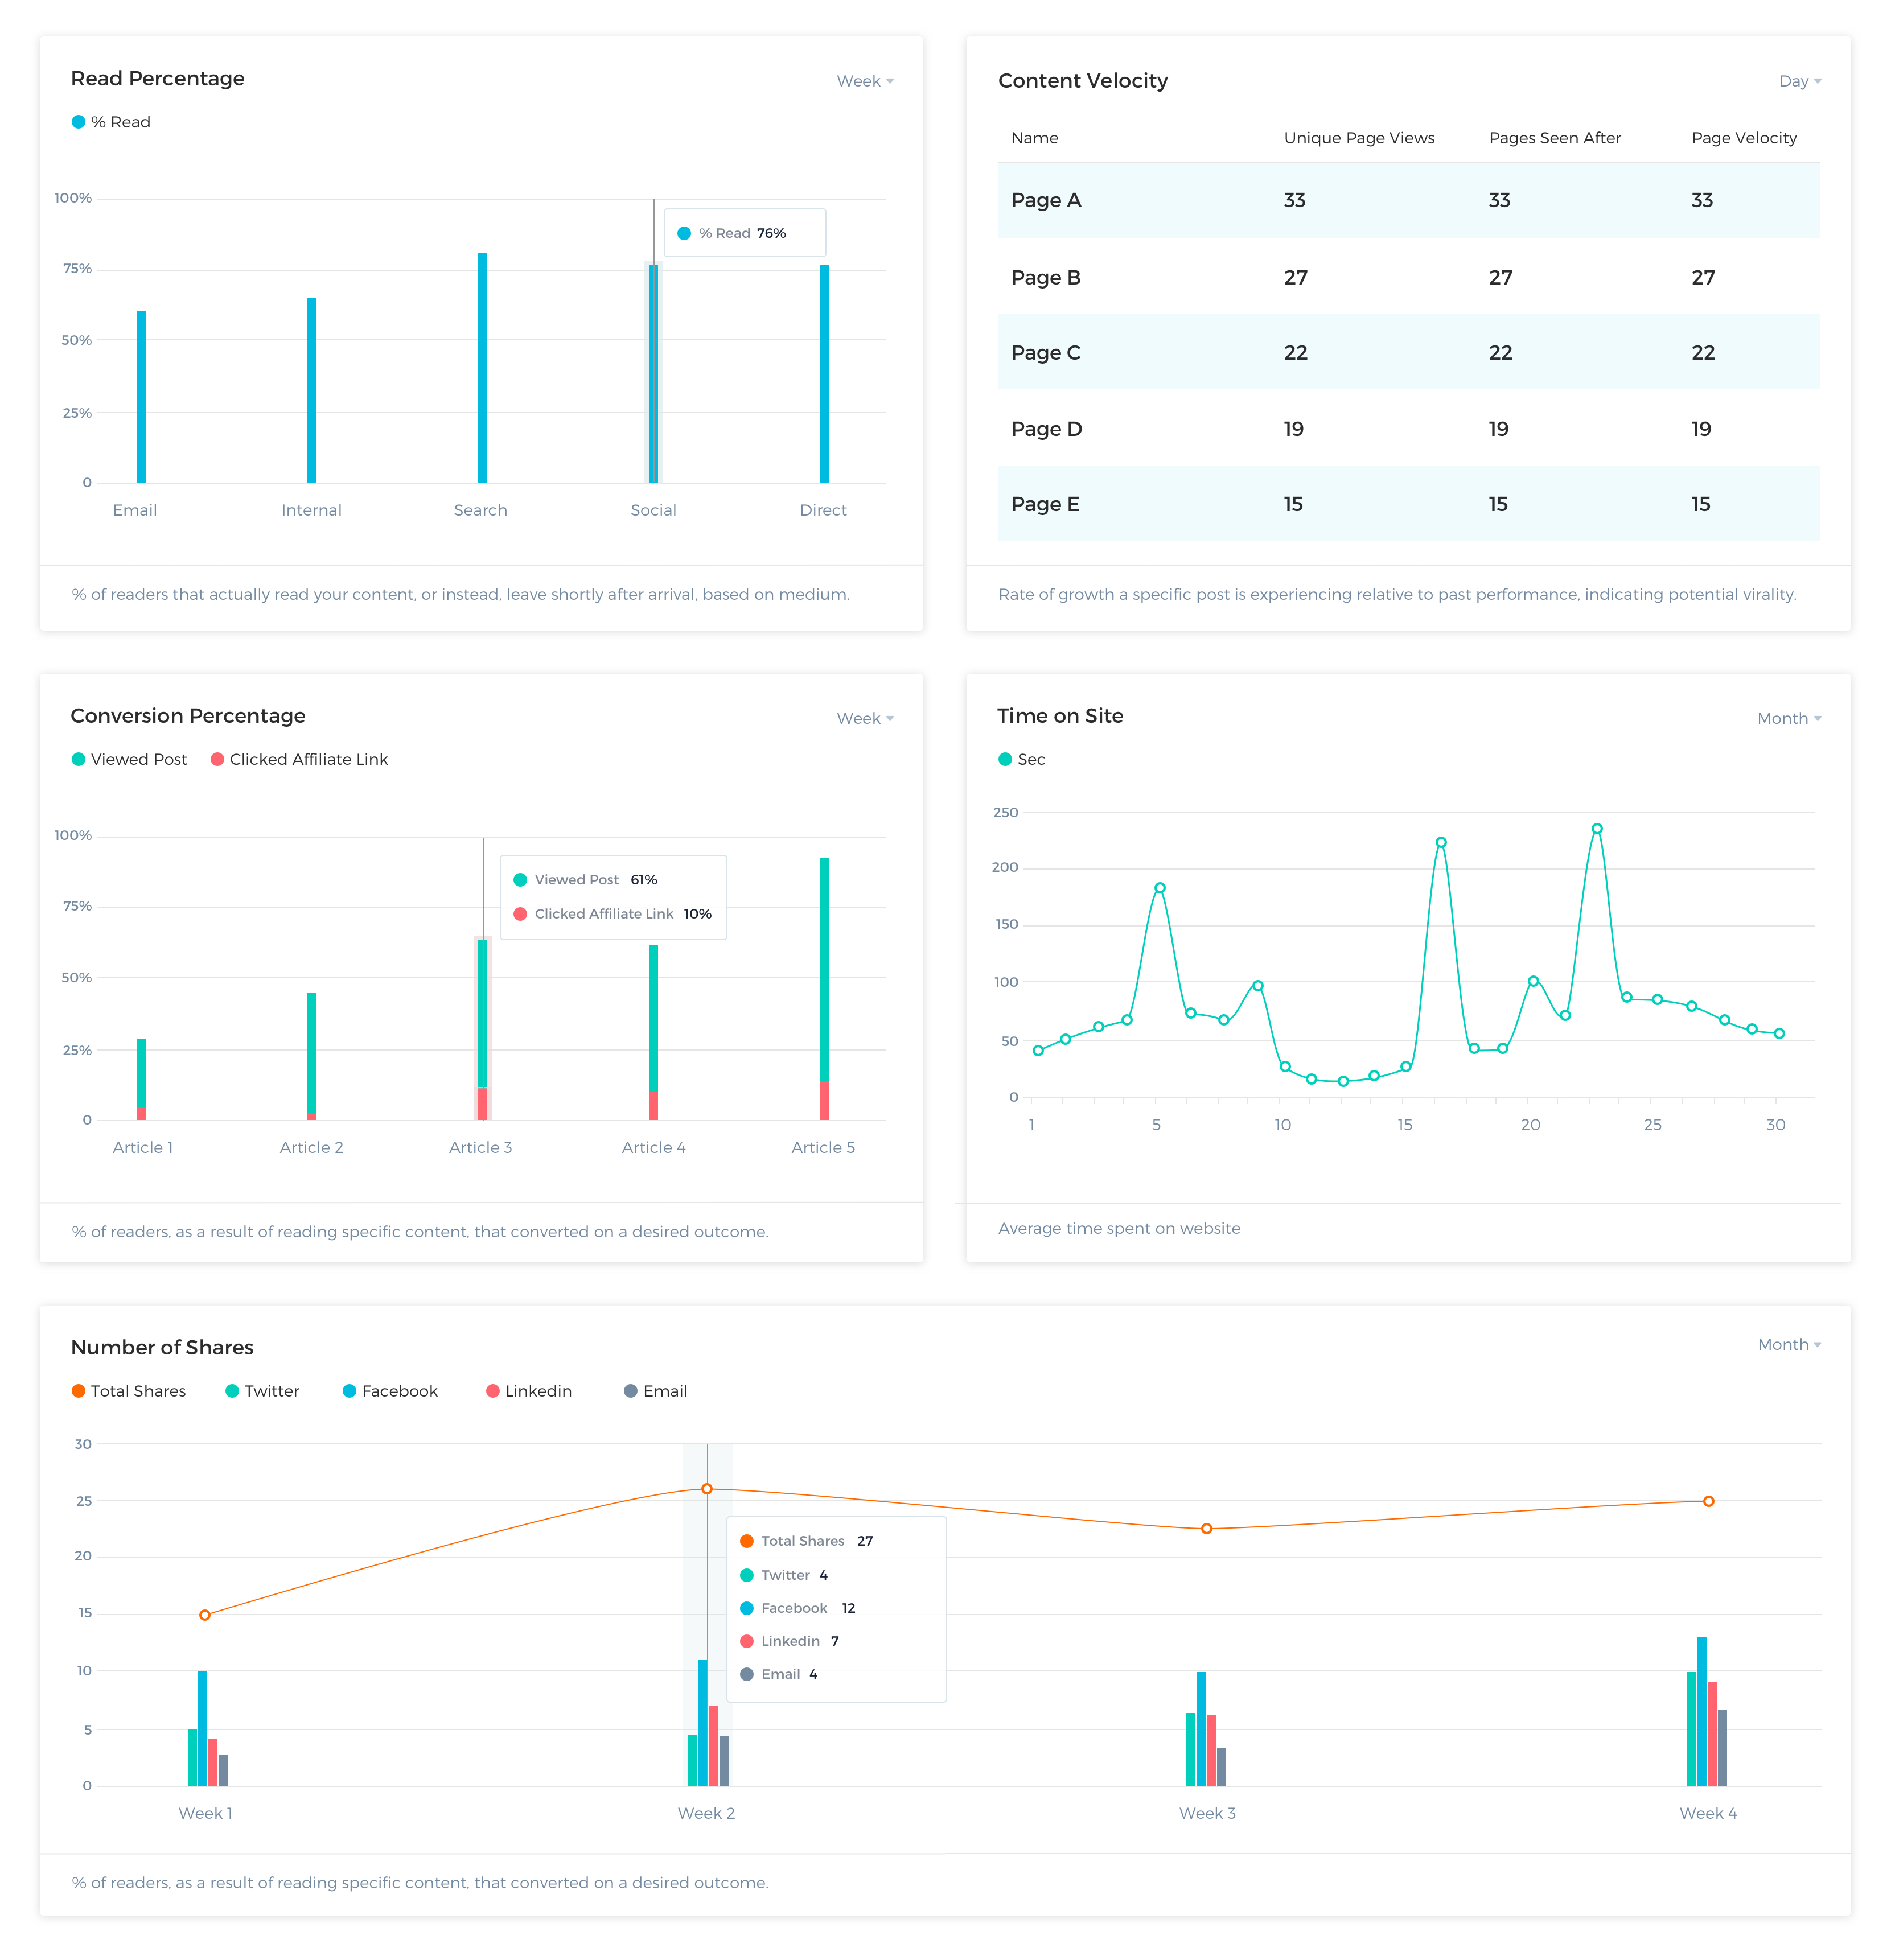
Read Percentage: What percentage of visitors actually read the content vs those who leave shortly after arrival?
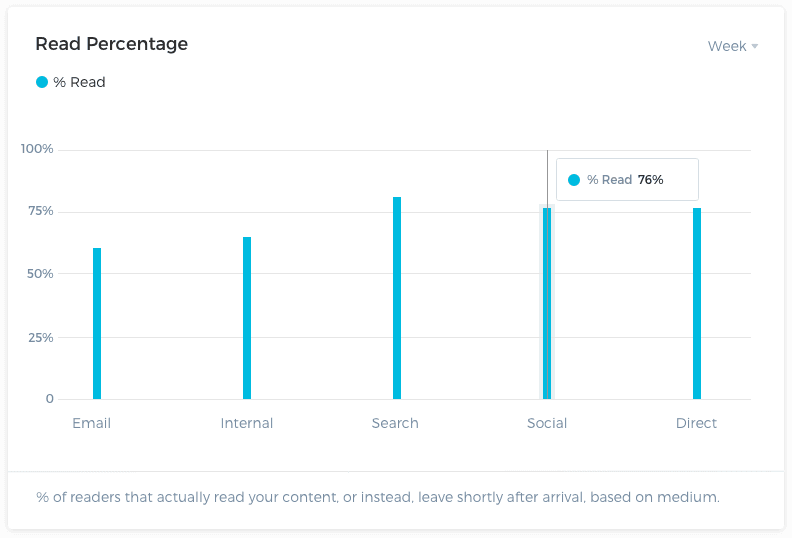
For example, let’s say a new user searches for something on Google and as a result lands on https://www.usatoday.com/. You need to track whether they actually stayed on the page, or quickly bounced because they didn’t find what they were looking for. If several visitors bounce shortly after arrival, it could be an indication that the content didn’t resonate with people searching for the keywords that yielded USA Today in SERPS (search engine results pages).
You can even group your read percentages by referral medium so that you can quickly see which source is resulting in more reads, giving you an accurate answer to where promotion efforts should be directed.
Content Velocity: This metric indicates the rate of growth a specific post is experiencing relative to past performance, which is an indicator of potential virality.
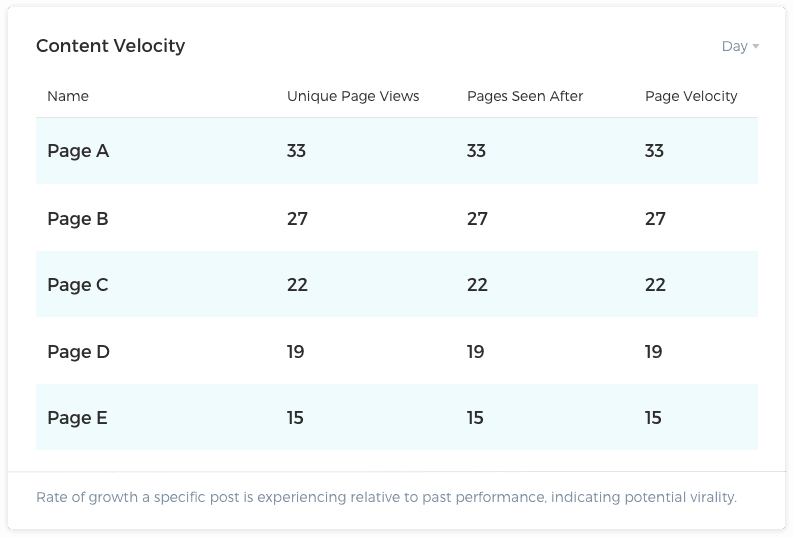
Let’s say a reader lands on a page on The Texas Tribune website as a result of a news story trending statewide. They read the post, and then share it on social media. Shortly after that post is shared by many other people. Soon, it’s gone viral and is getting national attention. However, a year prior, a similar story broke and no one shared it, and since no one cared, the story became old news fast.
What was so different about this latest story versus the nearly identical one that broke a year prior? Using the content velocity metric, your news editorial team can analyze the two pieces to see if there was something special about the latest story that made it go viral. This knowledge can help your publication improve future breaking news stories, and hopefully garner more website visits because of the tweaks made to future content.
Conversion Percentage: This metric can be used to analyze several things. You can track analytics for things like conversion rates of visitors to:
- Subscribers
- Clicks on an advertisement
- Product purchases if your publication sells products
- Click-throughs to another piece of content
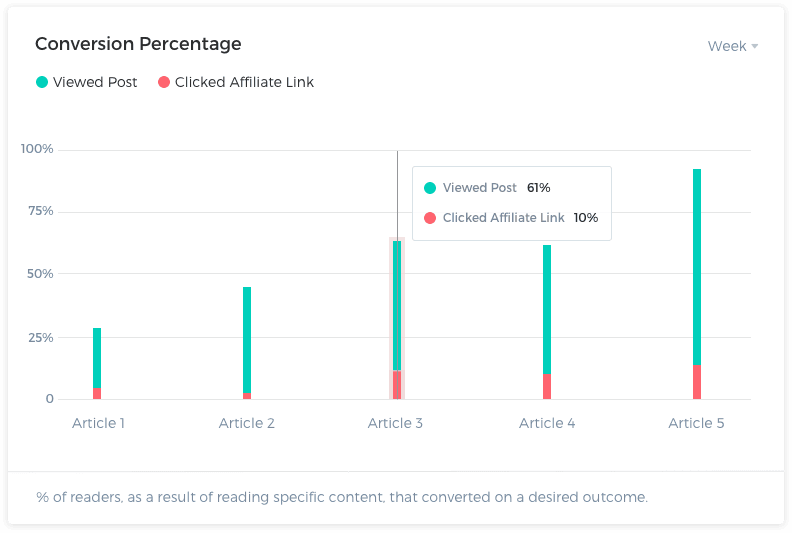
Let’s take Glamour Magazine, for example. If a visitor comes to one of their articles a few things can happen. First, they may be greeted with a pop up to sign up for the email newsletter. Some articles on the website feature links to affiliate partners that the magazine will get a kickback from if the reader makes a purchase. Other articles feature ads on the side that the magazine may receive PPC (pay per click) revenue from. By tracking these conversions, the magazine can learn what their users are interested in and then give them more of what they want.
Time on the Site: How long did your readers stay on the page? Or, how long did they stay on your website in general?
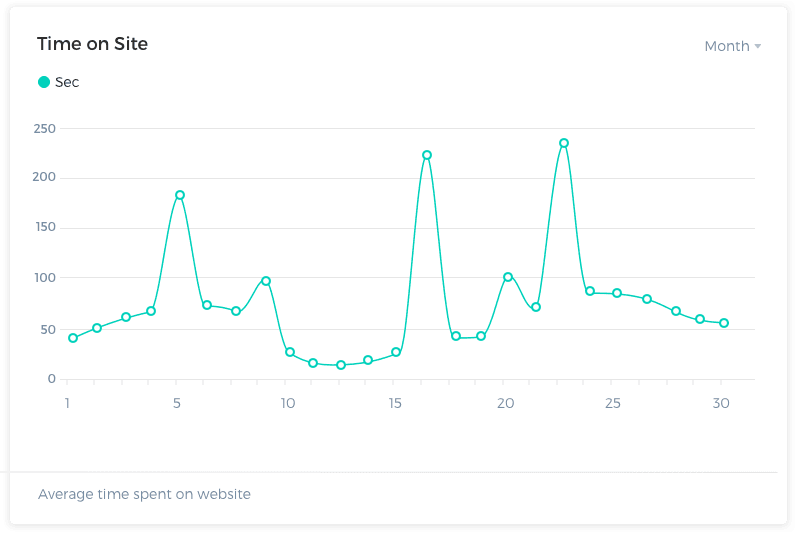
Perhaps a user stopped by for one article and then saw a link to another furthering the amount of time spent on your website overall. If your readers aren’t clicking through to other posts on your website to spend more time on it, perhaps your headlines aren’t attracting their attention enough. Or, if they didn’t spend much time on the article they landed on, it could indicate they were dissatisfied with the post in some way. The more data you can collect, the easier it will be to predict and understand user behavior.
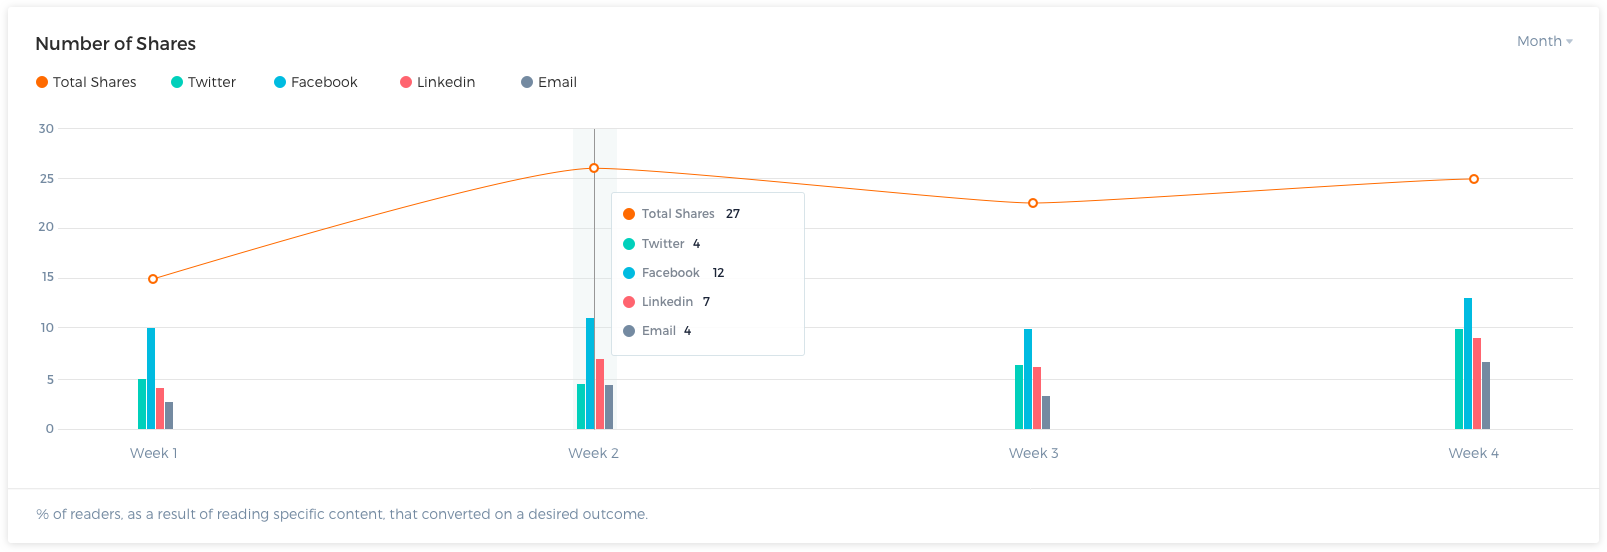
Number of shares: How many shares did your posts get on social media or via email?
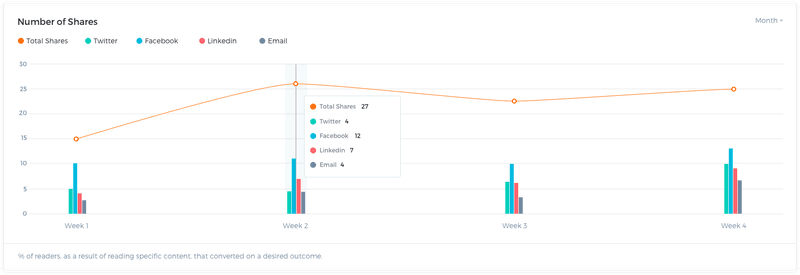
To view this graph larger, click here.
Numbers like this can help you determine how likely it is that your content will go viral. Then after a piece of content has gone viral, you may be able to analyze that piece to develop a recipe for virality for future posts.
Whether you need data-driven insights into what types of content are performing best, or need the data to relay to your advertisers, you need to be able to visualize these metrics. In other words, you need to be able to track the end to end experience of a user from the moment they land on your page, to the moment they leave, and everything that happens in between.
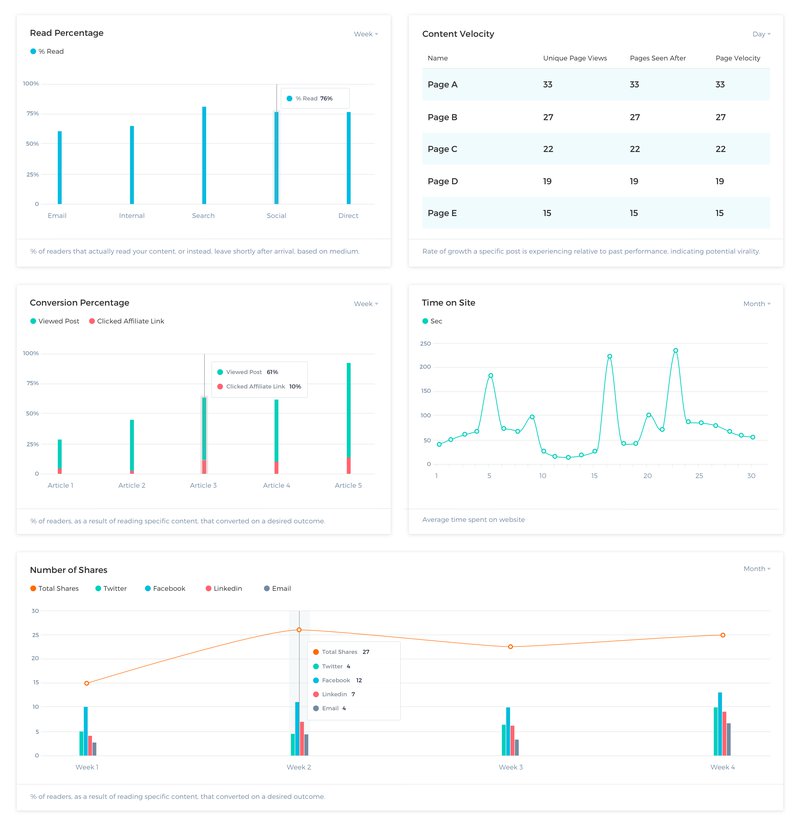
To view this dashboard larger, click here.
Content Analytics Paint a Clear Picture About Your Users
By analyzing data on a number of metrics, you can tell a story about the members of your audience. Your publication needs an in-house solution that displays this raw data in an actionable way through customer-facing dashboards.
The best option for your publication to build a custom analytics solution is to do it with Keen IO, the embedded analytics solution that can help you show potential advertisers, and other brands how your content rises above the rest.
Remarkably, you can produce the above-mentioned metrics with only two Keen Events:
- Page Views: runs once on page load.
- Page Scrolls: runs each time a user scrolls through a page.
How Does Building a Content Analytics Dashboard with Keen Work?
When you work with Keen, you can build a customized, in-house analytics solutions that enhance, rather than disrupt the front end experience. You simply tell our data visualization experts what you are looking for, and they work with you to create an un-opinionated, beautiful, and understandable dashboard of crystal clear data that is actionable.
Regardless of the amount of data you need to collect, it can reliably be collected and sorted in a way that is relevant for your sales team, editorial department, and even your potential advertisers. Imagine being able to deliver live readership data with complete flexibility of query control. Unlike out of the box solutions that are sometimes limited, and skewed, your company can focus on the content analytics that matters most to you.
The best part, when you work with Keen for your build, you will be supported at every stage of development. You don’t have to do it alone. Let our team help you create your content analytics dashboards faster so you can start acting on the data quickly, and get the upper hand on competing websites.
Still on the fence? In just a few minutes, you’ll learn why Keen is the fastest platform for powerful in-product analytics. There’s nothing to lose, so don’t wait. Get started today!
**This article was originally published on the 21st of August, 2019, and was updated on the 17th of April, 2020.


