Starting on Sunday, December 6th, many of our customers began to experience extremely slow queries. This is not something we take lightly — the speed, performance, and reliability of our platform is extremely important to us, and the last thing we like doing is letting you down. We are so, so sorry for any problems or inconveniences these recent issues may have caused you.
The good news is that we’ve since identified the causes of the problem and are working to implement long-term solutions to prevent recurrence. We are also working to improve visibility within our growing platform, which will allow us to respond more quickly to these types of issues.
Here’s a full rundown of what happened, how we fixed the issue, and what we’re doing to ensure it doesn’t happen again:
A Lot Changes in 6 Months!
6 months ago, we fired up an optimization layer to help speed up our analysis API. It worked, and queries got faster. However, we recently identified a potential bug in this layer, and decided it would be easier to debug if the layer wasn’t running. We disabled this optimization for further analysis and monitored performance. Initially, things looked good. Everything was within expected, acceptable levels.
Sunday morning, however, we noticed more queries than usual. On the whole, it’s exciting to see heavier usage, but the number kept climbing, and it wasn’t following our normal patterns — especially for a Sunday. Some customers were doing cleanups, deleting stale or incorrect data, while others were doing some bulk imports — all reasonable usage — but there was a lot more of it than usual.
The Keen platform is optimized for fast reads, and mutations are limited. (We don’t allow updates right now). As the increase in requests came in, our processing layer (for both reads and writes) was predictably under a heavier load. Upon inspection, we found some suboptimal settings for the JVM memory usage that were causing some OOM exceptions and significantly larger garbage collection sweeps than what should be necessary.
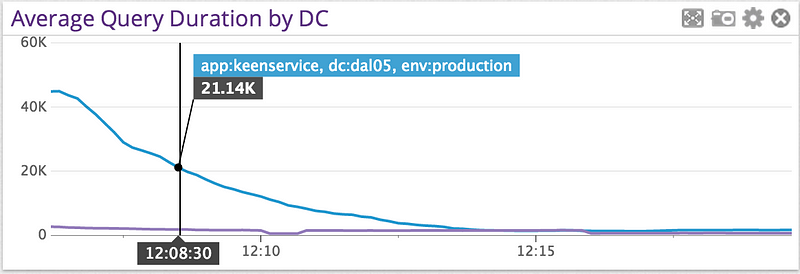
We quickly made some changes, tested, and deployed, and then saw a trend we love here in performance monitoring: down and to the right!
Unfortunately, this didn’t last long, and soon queries began stacking up again. It became clear that this wasn’t going to be solved by tuning our systems. Usage was still increasing, and our performance was decreasing.
It’s Not Cool to Fight Voltron
On its own, disabling the optimizations wouldn’t have caused us any significant trouble. Neither would the increased and uncommon usage. When they combined, however, it turned into quite a nasty battle robot.
By the time we were able to identify the issues and begin our response, we had a growing backlog of queries. Query durations started to timeout after 5 minutes, which is our internal “we took too long” limit. (We also realize that many customers have their own client-side timeouts, often shorter than 5 minutes. This makes it difficult to determine the true end-user impact in a situation like this, and there were many retries of these failed queries.)
We had to look deeper into the platform, and the next stop was investigating slow reads at the storage layer. We noticed Cassandra read latencies spiking regularly and grinding everything. We found that there were some hosts that weren’t configured quite right, and also that the load between hosts wasn’t uniform (some doing double duty, others shirking!). We made changes here, and while there was a slight improvement, again, it didn’t last. Our optimism faded as queries continued to increase. Even though queries were still timing out, we were receiving more and more of them. This was a bad combination.
We felt that without implementing more significant architectural changes, we had no more options. We had done all the tuning possible. Our optional optimizations from 6 months ago were no longer optional; they were entirely necessary. Our system, and company, has grown so much that what was once an added perk was now critical to the ongoing functionality of the platform.
So, from there, we re-enabled the optimization processor. It started with a massive backlog of work to do, but as it worked through, we began to see improvements. While queries were still slow, they were getting faster and faster. And, the best part, they stayed fast. After 12 hours, we felt pretty confident that all of our efforts paid off. But, of course, our work isn’t done just getting things back to normal.
What Comes Next!
No post-mortem is complete without a list of changes and ideas to further improve ourselves — and prevent the same sort of things from happening again.
We now know that we need to have better reactive capacity planning, so that, when customers need extra power, we can deliver it without impacting the rest of the platform.
Similarly, we now understand that we need to have better abilities to throttle and rate-limit when necessary to get the platform back up to optimal performance when things mess up. While our rate-limiting capacities have improved recently, we still have a ways to go in this respect.
The other side of rate limiting and throttling, however, is the impact on our customers. We definitely understand that it’s frustrating for a service to start throttling usage, especially if it’s unexpected. Therefore, we need to be more proactive and improve our ability to respond. We’re changing the way we monitor any rate limits, and how we alert when it happens. We’re implementing better notifications that get to the right the right people as soon as possible.
Finally, this incident exposed some of the gaps in our monitoring and early-alerting tools. Yes, we were being alerted of slow queries, but they weren’t failing in our own internal monitoring, nor were they timing out. We had to trace things backwards, starting from the top and inspecting, to really get to the core of the problem.
We rely heavily on Datadog for tracking our infrastructure metrics, and they made it really easy to find correlated issues to help guide us working through the stack. Unfortunately, we weren’t monitoring everything we should have been, so there were many times when we had to fill in the blanks. We have a big new list of metrics to track now, and some have already since been put into place.
A Heartfelt Thanks
In our last post-mortem, a recurring theme was the “opportunity” of learning. One of our core values at Keen is identifying learning opportunities where we can, and trying to seize them in every step of everything we do.
It’s pretty common to feel crummy when things go wrong like this. We love our customers, and the whole reason we’re here is to help you all out, so it’s hard when we have issues like this that have such a big impact. Our latest outage affected customers for nearly 24 hours.
The best thing we can do, though, is own up to our mistakes, apologize for them, and work as hard as we can to turn them into opportunities for learning and growth. We appreciate all of you for sticking with us as we build out and experience new trials, tribulations, and successes. Thanks for being on this awesome ride with us!
Have any additional questions? Need clarification on anything? Feel free to reach out to team@keen.io!


