Customers are the lifeblood of any business. That is why supporting them is critical to our success. Helpdesk software makes it easier than ever to take care of our customers needs in real time, even if we’re not online at the moment. If you have been considering creating a software product like this, there are several helpdesk metrics you need to address as you build your software to meet the needs of your own customers.
However, simply addressing these helpdesk metrics within your software isn’t enough. You also need to be able to show your customers the analytics and data related to them in a way that makes sense. Think line graphs, bar charts, pie charts, scatter plots, and more. The inability to deliver these analytics in an easy-to-read fashion could cost you a purchase.
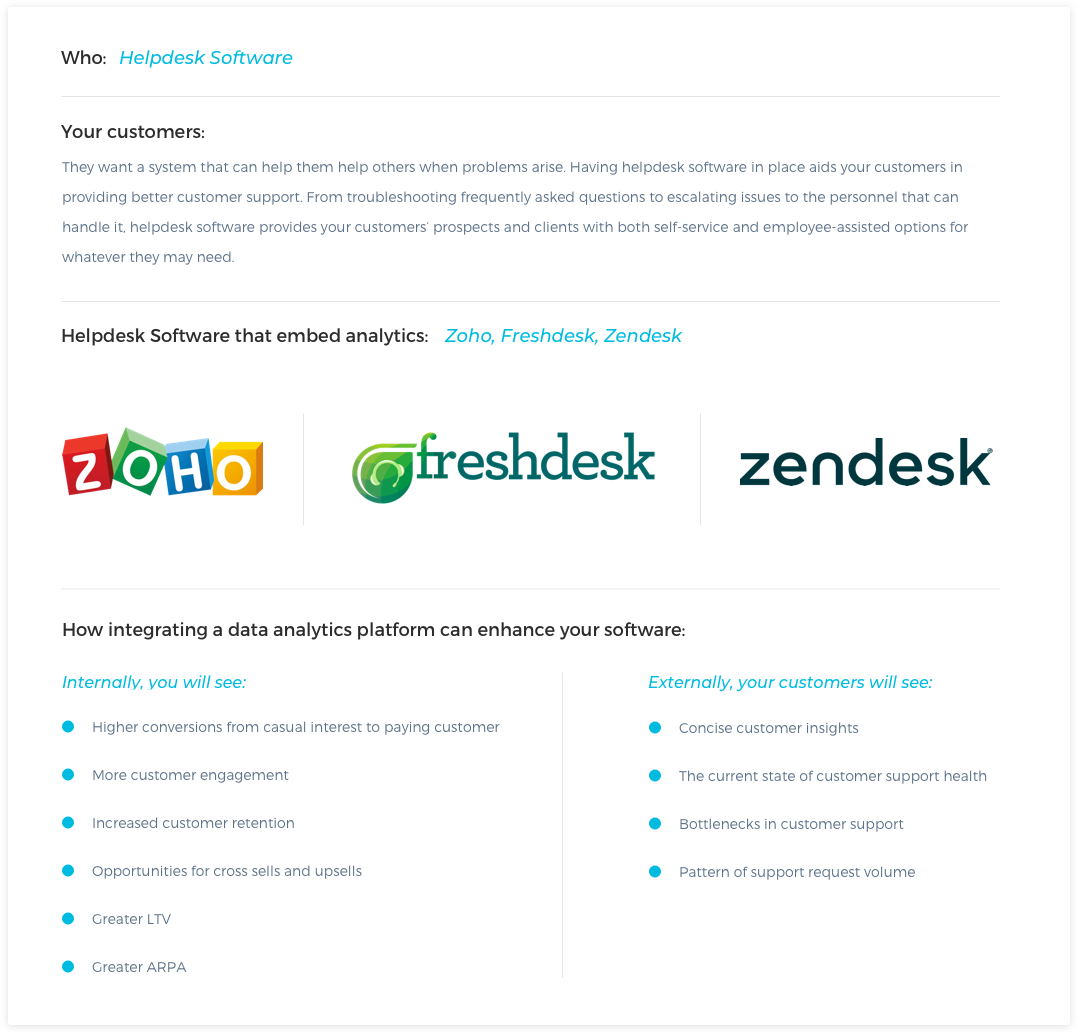
What your software needs to set you apart from your competitors is customer-facing metrics.
Customer-facing metrics give you the ability to share the data related to usage and performance with their customers via your software’s front-end, thereby emphasizing the value of your product over a competitor’s helpdesk solution.
Once you have all this data you have collected, what do you do with it? You can’t just give your customers a bunch of numbers that they have to interpret for themselves. After all, they won’t be able to act on this valuable information if they don’t understand what has been given to them.
Your job then, is to show your customers precisely how the data you’ve collected can help them in sustaining and/or growing their businesses. The data you provide them needs to be broken down visually so that it’s clear and concise.
Does This Sound Like You?
Current Challenges that Helpdesk Software Faces
With most helpdesk software solutions, the idea is to give your customers support as quickly as possible, even when their customer service representatives are offline. The objective is to answer questions and address concerns to maintain a healthy relationship between business and customer.
What your software customers need is a way to analyze the data they are collecting to keep track of their business’s state of customer support health. When you incorporate customer-facing metrics in your helpdesk software, you are able to provide your customers with easy to digest information that paints a clear picture not only of the current state of customer support health, but also where there is room for improvement.
Your Goal
The goal of helpdesk software is to provide your customers with a clear representation of current initiatives and activities, to visualize their path towards achieving company growth goals.
With that in mind, your software should be collecting and analyzing data on 8 key helpdesk metrics to empower your customers to take smart actions to improve their internal state of customer support health.
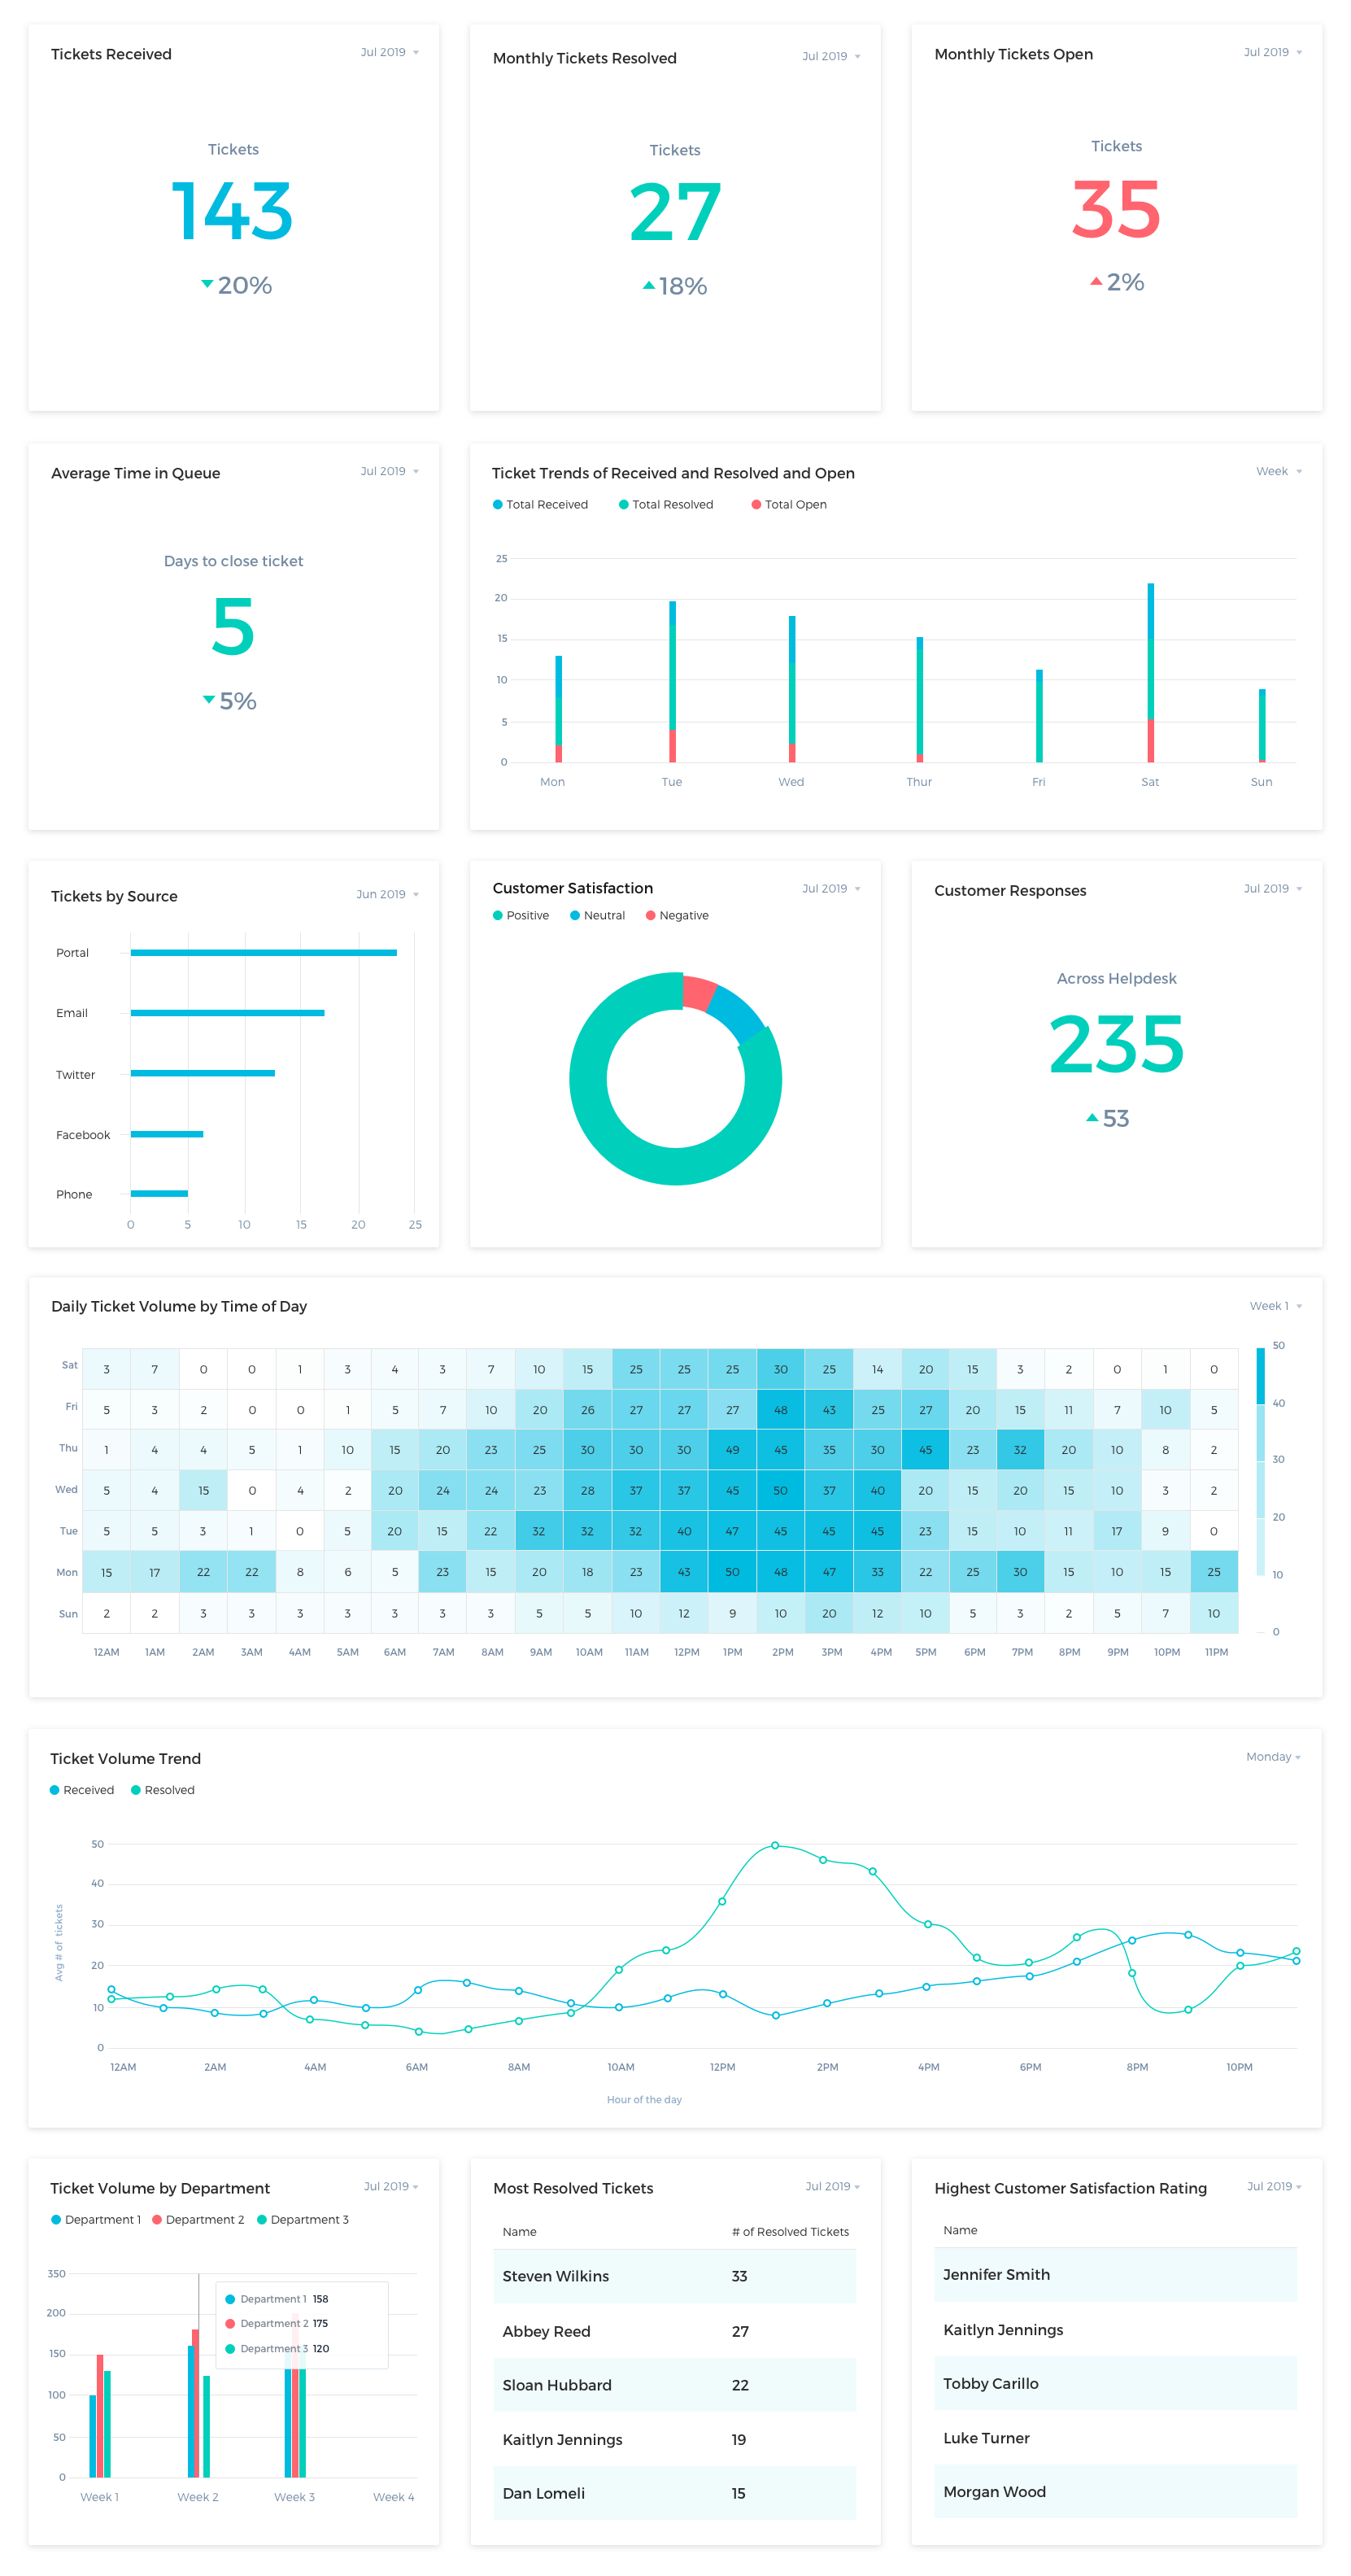
8 Helpdesk Metrics You Should be Tracking
1. Number of active support tickets
One of the things helpdesk software does, is create support tickets for customer service requests, complaints, questions, issues, etc. At any given time, a company needs to know how many support tickets are currently active. This metric will let them know if they need additional help in resolving the ticket requests, which can assist with things like hiring decisions.
2. Time in queue and/or response time
How long does each ticket take to resolve? How long are customers waiting for a first, second, third, etc… response? Answers like this are critical to customer support health. The faster tickets can be resolved, the better. People tend to be happier with prompt resolutions, after all.
3. Ticket trends
This metric gives your customers several key pieces of information such as a weekly snapshot of tickets recieved, tickets resolved, and tickets unreseolved in comparison to the same time frame last week. Being able to easily swtich between daily, weekly, and monthly views is a game changer.
4. Customer satisfaction rating
Typically once a ticket is resolved, a customer has the opportunity to share how pleased they were with the outcome. If customer satisfaction is low, the reason(s) may be easy to determine with other helpdesk metrics, and therefore correct.
5. Tickets by source
Being able to see where your support tickets are being generated from allows management to view trends, and create source specific content to better assist customers. For example, if the majority of tickets are coming through the portal, perhaps there is an opportunity to improve in-app messaging and educational snipets where applicable.
6. Ticket volume
Over time it will become clear when the volume of helpdesk tickets will increase. For example, your customers may find that helpdesk ticket volume goes up during holiday sales, or when a new service is launched. By using this past data you can predict when backlogs may be an issue and additional support staff can be brought on board to resolve those tickets faster.
7. Ticket volume by department
Does one department get the brunt of helpdesk tickets? If so, they may need additional help. Or, there could be another factor at play such as tickets being routed to the wrong departments. Either way, more information is the key to solving tickets more quickly and efficiently.
8. Individual performance
How are individual CSRs performing the tasks expected of them? In some cases, your customers may find that their support agents are performing well, and deserve things like promotions and raises. In others, they may learn that their CSRs need additional training to perform better on the job.
Embedding Customer-Facing Helpdesk Metrics in Your Software
Your customers need a way to interpret the data you are collecting within your software. With this data, they can make more informed decisions with their customer service teams. But, once you decide to include customer-facing metrics in your software, how can you implement it, and make it easy to read and understand?
Upon researching your options, you’ll find you have two choices:
- Build from scratch: This is the most complex and time consuming route
- Buy and implement: Work with a company that offers you a custom flexible solution
Create a custom analytics solution for your Helpdesk Software in-house.
When you build your own solution, you have complete creative control over everything from the data analytics, to the infrastructure. You also will have total ownership over what you create, as well as flexibility with how data is queried and displayed. Add to that the fact that anyone who helps in building the solution will enjoy a nice enhancement to their resume. That is until the realization of the cost and time to produce it kicks in.
The truth is, building a solution for custom analytics can be quite costly in more ways than one. The tradeoff of building in house vs not can be weighed by these three things:
- Opportunity cost: You and your team could be working on something else
- The risk of creating a subpar solution: You run the risk of building a solution that is brittle, not flexible, and hard to manipulate in the future as customer needs change
- Required resources: You’ll need specialized resources to really setup correctly, which can sometimes be hard to find and attract
The better way – Partner with Keen to create your data platform.
After considering the time and financial cost of creating your own solution, you might be tempted to buy a ready-made solution. The trouble with this idea is that while they are fast and simple, they have significant limitations. You might not have access to all of the customer-facing metrics your software customers are going to need. There is a better way.
Imagine having a partner by your side to help you create a customer analytics solution faster and cheaper, without limitation. Enter Keen, the embedded analytics API solution you’ve been searching for. By combining your helpdesk software with our platform, you get a custom solution perfect for you and your customers. All this faster and cheaper than it would be if you built it yourself.
It’s never been easier to provide your software customers with the visual information they need to improve and grow their companies. We work with you hand-in-hand every step of the way.
Here’s how it works: Bring your mock-ups to us, and we work with you to implement a data model as well as a front-end experience to match designed to spec. Even if you don’t have a mock-up, we can have our data visualization experts create a dashboard that is beautiful and will impress your customers.
From there, we will work with you to customize your in-product analytics, and integrate with existing platforms and applications easily. Your new and improved software can be ready sooner and for less of an investment than you might expect.
Learn more about the difference in these options in our Build vs. Buy whitepaper.
With Keen by your side, your helpdesk software will have a leg up on your competition
Minimal development time, and a design that is as simple as copy and paste? It’s a win-win. And, you will be supported by our designers and engineers every step of the way.
Learn more about how Keen can help you provide powerful in-product analytics for your software. Request a demo here, today.