Devin, one of our platform engineers, recently made a change to our Keen IO Status page. He sent out a great email to the rest of the Keen IO team with a detailed explanation of how and why. Since this was a new user-facing metric, I wanted to share this with the users since it will help users debug, check on our platform’s status, and get a clearer picture on the inner workings of Keen IO. Thanks for taking the time to write this email, Devin! –Taylor
TL;DR We have a new user-facing metric for transparency and to act as an aid in debugging for our engineering teams.
Out with the old
I have updated our status page with a new metric and removed an old one. Previously, we had a metric displayed that showed the “Write Event Delta”, or the number of events that our users had supplied to us for writing that were still waiting to be written to Cassandra. This metric wasn’t particularly meaningful to our users — it is hard to know what 3,000 events waiting meant versus 12,000 events waiting.
In with the new
The new metric is the “Event Write Delay”. This indicator shows how long events are waiting to be written to our data store, Cassandra, in milliseconds.
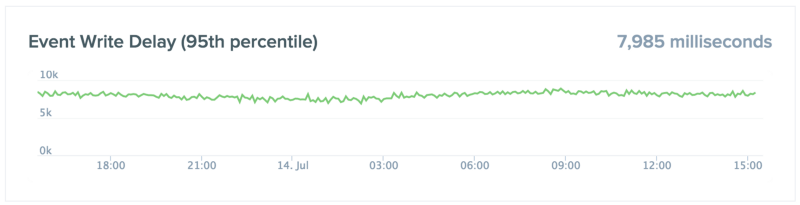
On a normal day, Keen events are available to be queried approximately 6 seconds after sending them. We wanted to provide further transparency into the length of time our users will have to wait between writing and reading at any given time, so we added the Event Write Delay metric to our status page.
This metric matters because until an event has been written in Cassandra, it will not show up in any queries. We are displaying the 95th percentile of these delays which is a conservative estimate of how long a customer should expect their events to wait before being available for queries.
The 95th percentile typically hovers around 8.5 seconds over one day’s window, while the 50th percentile hovers around 6 seconds as mentioned earlier. The graph may change when we make a configuration change or experience a relevant incident that could push these delays upward, we don’t expect this to happen very often as we work hard to make sure the event write delay stays consistent!
Who does this impact?
First, our users have better access to company transparency, which is a win. Secondly, our support team can point to this graph to help answer questions about why events are not immediately showing up in queries.
Additionally, this can serve as a debugging aid for the Platform and Middleware teams.
How is this measured?
As events are passed to us, they pass through a “bolt” (a piece of code), which writes batches of events to Cassandra. This bolt is the location where I added some code that will sample roughly every 2000th event that we write. We compare the current time to the keen.created_at property and take the difference. This tells us how long the event waited before it was written to Cassandra. Sampling only 0.05% of our events written still gives us about 3 events every second which I feel is sufficient to produce this metric without incurring any performance costs.
Special Thanks (because regular thanks wouldn’t suffice)
Shout out to Cory for helping with the visualization aspect in the status page and Datadog. Double shout out to Kevin for helping me understand enough of our back-end to make this happen as well as reviewing the code.
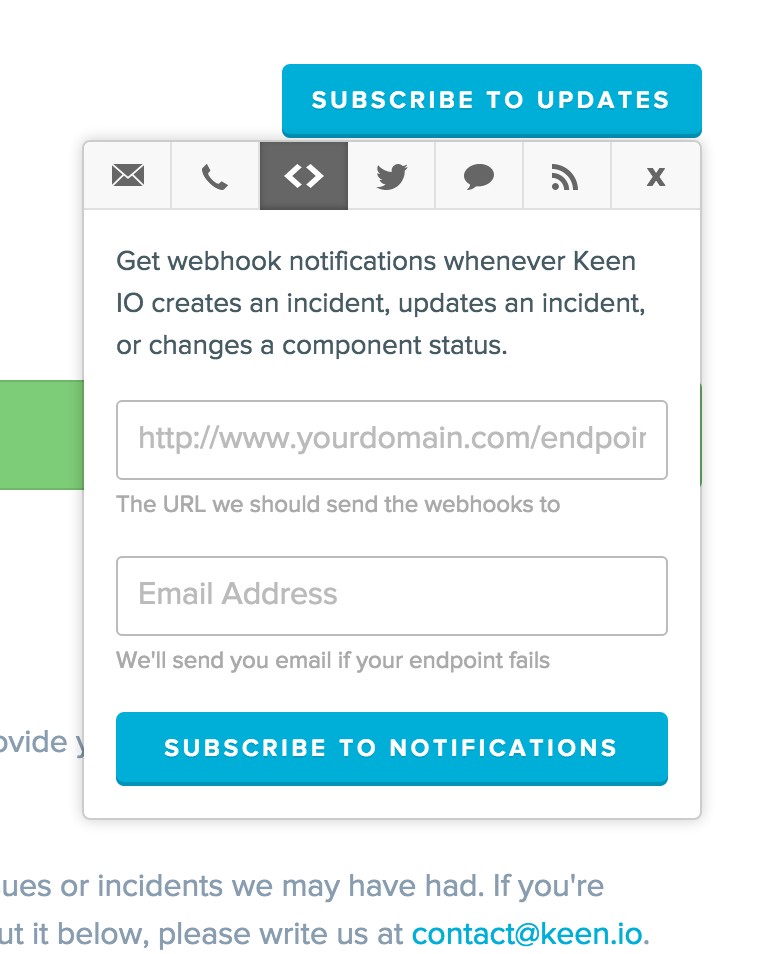
We also recently enabled Webhook Notifications on our status page, which you can subscribe to as seen below at status.keen.io. This can be super helpful if you are wanting to be notified via a webhook about an incident on our platform. Our goal is to give users as many tools as possible for their toolkit when using Keen IO. –Taylor