For anyone who’s built one or more dashboards, there is a common practice I have termed “copy pasta” code. This is where you copy and paste a single code block multiple times and then tweak one or two parameters here and there. This can happen when using the Keen API to build a single page with a bunch of charts (AKA a dashboard).
There has to be a better way, though! All that copy and pasting means that making changes and updates is error-prone and tedious. In a recent revamp of one of our open source projects, Pingpong, I decided to tackle this very problem.
HTML data attributes are your friends
HTML5 added data attributes you can use to store custom data for a given element. What if we moved all of the customized information for a given chart into data attributes and had a single JavaScript function to render each one?
In the context of the Pingpong project, I wanted to have a status page for checks with a variety of charts, but I wanted to make it easy to play around with the different display styles of the charts and deal with “global” filters for all of my queries. Updating each of the charts every time was tedious, though, so I took the old HTML that looked like this:
</div> </div> </div>
</div> </div> </div> </div>
and turned it into this:
</div> </div> </div>
</div> </div> </div> </div>
All of the chart-specific information is now part of the DOM, and if I want to change something on a single chart, I can just edit that div element.
One JavaScript function to rule them all
The “copy pasta” method of rendering charts with the Keen JS SDK is straightforward, but it means that often your code turns into:
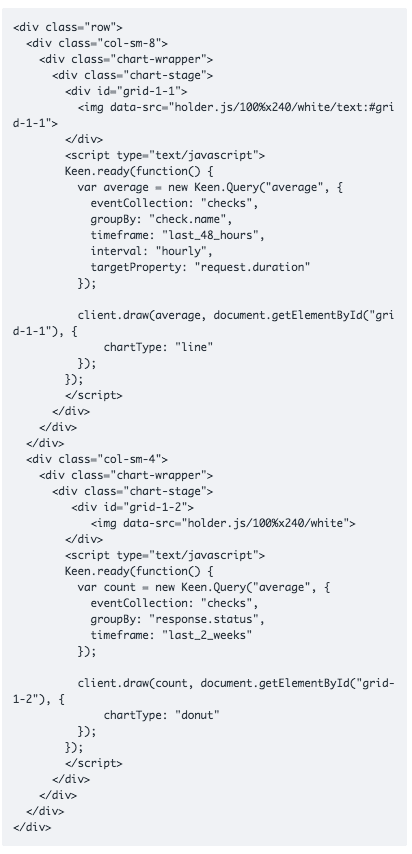
This code works, but there’s quite a bit of repeated code in there, and we could pull all that information from the DOM elements if we used HTML data attributes.
So instead, let’s add a single JavaScript function that handles the JavaScript elements of rendering a chart by pulling information from the data attributes (I’m using a lot of jQuery helpers)!
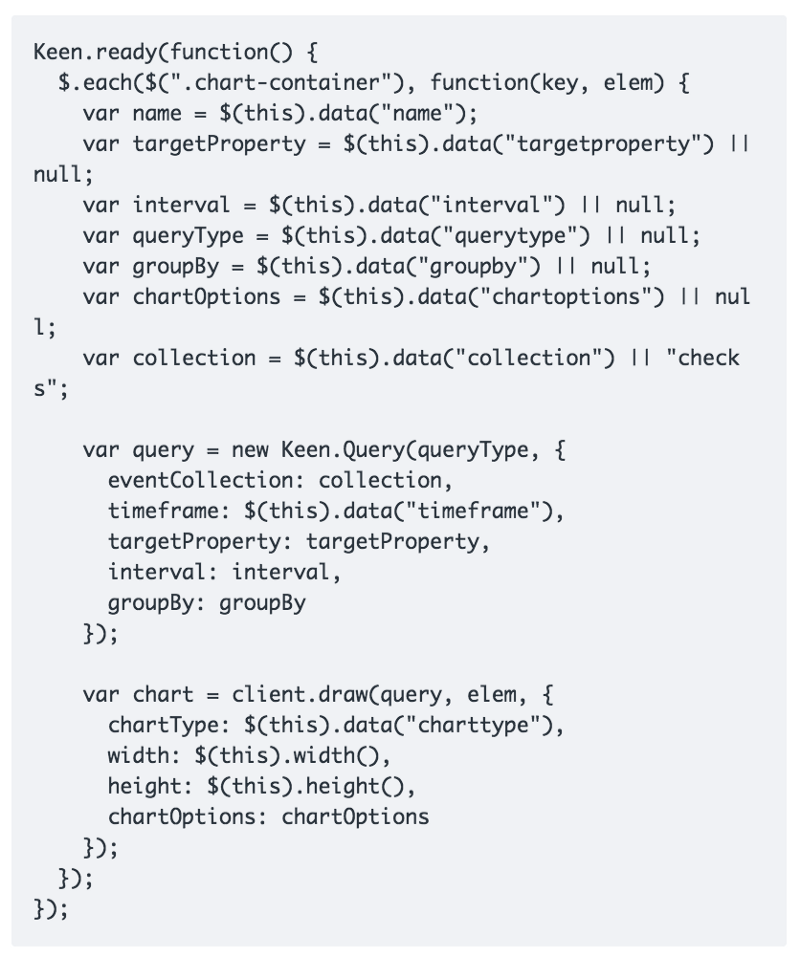
So, what does this do? Now any element with a class of chart-container will get a fancy Keen chart attached to it based on the metadata in the data attributes.
If I want to apply a filter to all charts, I can do that in this function! If I want to enable per-chart filters, that’s easy to do, too. If I want to play with the c3library or chartjs, it’s easy to swap out all the charts on a given page.
Hopefully this is helpful in making dashboard pages manageable to maintain and modify! If you have any questions or additional ideas about how to use this technique, feel free to let me know.


