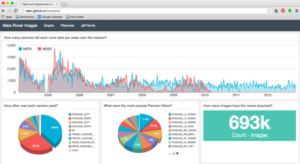
NASA rocket scientist , Dr. Jeff Norris gave the closing keynote at KeenCon, and we were already kind of freaking out because it was seriously the best talk we’ve heard maybe EVER. But then he went ahead and just broke our brains completely when he surprised us with a demo of Mars rover image data in Keen IO.
Dr. Norris used Keen to answer questions like “How often was each camera used?” and “What were the most popular Pancam filters?” He also asked, “How many pictures did each rover take per week over the mission?” and in the process identified a 9-year-old archiving bug that NASA is now investigating! (It’s the dip that shows up in 2005.)

We can’t really even begin to describe how much this blew our collective minds, but the look on our CEO Kyle’s face when Dr. Norris first pulled up the rover dashboard is a pretty good start:

When Keen was first getting started, the team put together a list of “dream customers” — the ones we’d always keep chasing, the ones we thought would get what we were trying to do, the ones we thought we could really make a difference with. NASA was on that list. So, with that one little dashboard, a whole lot of dreams came true for us. Thanks, Dr. Norris! You kind of made our year.
In case you’re wondering, Jeff used Keen’s open source dashboard templates to visualize the Mars Rover data.
If you want to start playing with Keen, have questions about the rover pics, the dashboards, or just want to geek out with us about how cool this, reach out to us or ping us on Slack.


