Thank you to everyone who listened, shared, and asked questions at our first Data Visualization Show and Tell. We learned a lot and had tons of fun. We hope you did too.
A big thank you to our speakers:
Keen.Dataset, Dustin Larimer
Drafting and Experimenting with Data to create a Final Visualization, Will Johnson
Your Data Doesn’t Mean What You Think it Does, Zan Armstrong
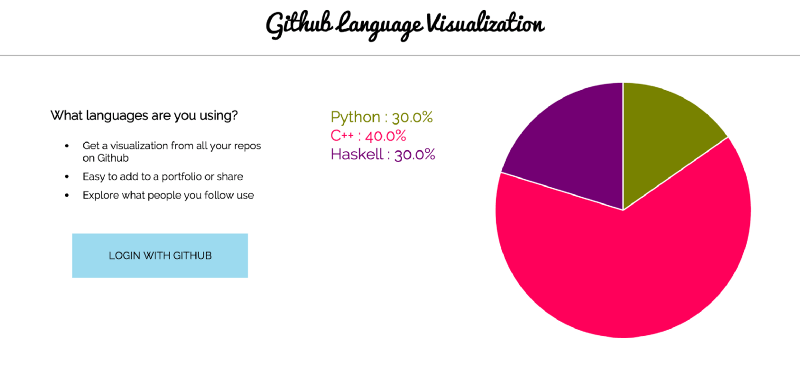
Github Language Visualizations, Rebecca Brugman

In-product viral growth patterns seen at DocuSign, Chip Christensen
Discovering hidden relationships through interactive network visualizations, Kaustuv De Biswas, Mappr
To stay up to date on data visualization projects and events, subscribe to our monthly dataviz digest 🙂 If you have something you’d like to see featured in our next digest, shoot us an email!
Till next time!


