We’re excited to release Data Explorer, a brand new and improved version of the Keen IO workbench for querying and visualizing your data.
Many of our customers use the workbench to run ad-hoc queries, create quick charts, and extract data. We’ve made that even easier and more enjoyable with the new Explorer.
To check out the new Explorer, go to your project page in Keen IO and then click on the Explorer tab! Let’s walk through building a query, and some of the new things you’ll see.
If you haven’t sent data to Keen yet, and want to play around with Data Explorer, please check out our getting started guide!
First, build your query:
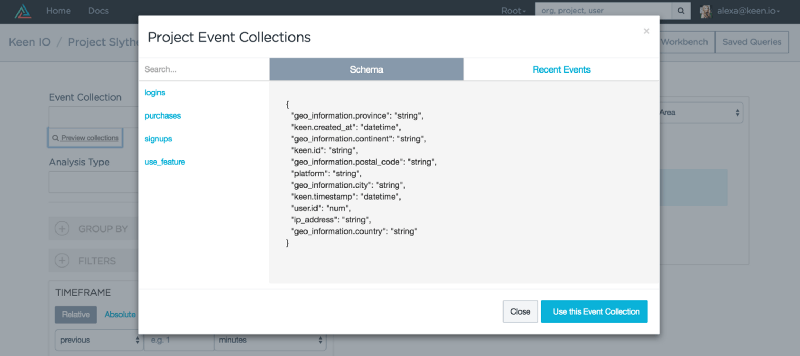
- View your event collections and schema without leaving the page, using the new preview button that gives you a quick glance at your schema and recent events

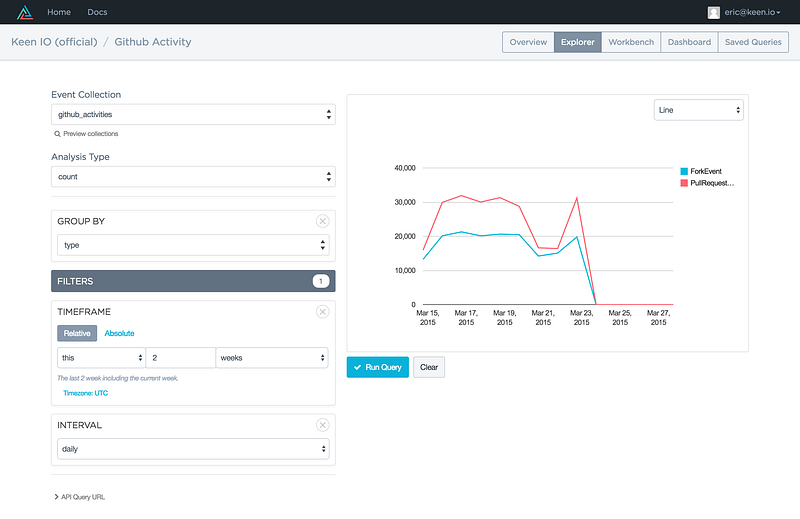
- Easily select the right collection and parameters for your query, using our dropdown menus. Just start typing part of the word you’re looking for and it will autocomplete!
- Build a filter for your query, using the event type as a base for your filter — choose from string, number, null, list, Boolean, or datetime
- Try out the new geo-filter, which enables you to to filter events by latitude/longitude
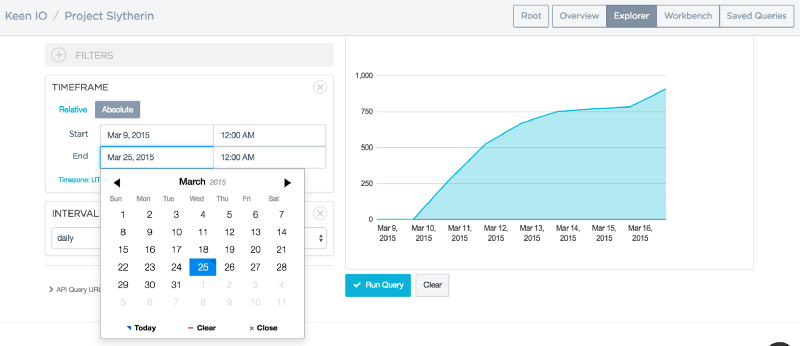
- Pick a date and time range for your query using our calendar selector

Next, beautifully visualize the results of your query:
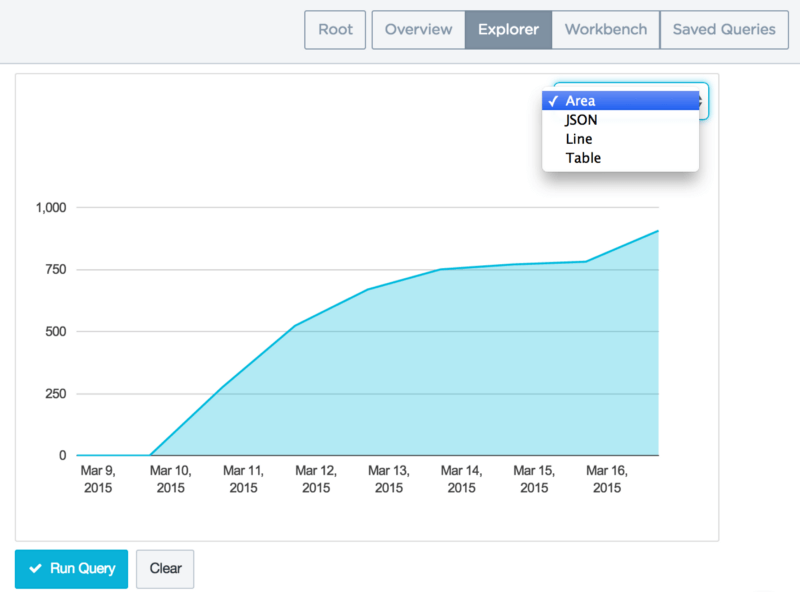
- Toggle between different visualizations of your data, choosing from chart types including area, line, or pie. You can also view your results in a metric or JSON format.
- Embed charts anywhere by viewing the source code and pasting it anywhere
- Save your favorite queries, so you can come back and access them again and again
- Select the table output to view your data as a simple table

Alternatively, extract your data by email or preview an extraction in the browser:
- View up to 100 events as a preview table in the browser
- Send a full extraction to your email, with an optional limit on number of events to extract

Our first couple years at Keen, we focused primarily on building the API and backend tools. While that remains our top priority, we now have a team of engineers focused on building out our front-end and visualization offerings, and Explorer is our first product release. We’re excited about growing this team to better serve your needs.
We’ve also worked closely with a set of customers to test out the Explorer in beta, and we’d love to give a shout-out to them here for their patient feedback and suggestions. We would also like to get your feedback on how you like the new functionality. Email explorer@keen.io with any comments, feedback, or suggestions!
Update: The Data Explorer is now Open Source! You can check it out here.
You can request a demo today to start exploring your own data. Happy exploring!


