Native Analytics Overview
What is Native Analytics?
Native Analytics is a suite of tools for white-labeling analytics in your product. Keen powers the backend analytics infrastructure so that you provide your users a truly new and custom analytics experience.
Native Analytics is all about spreading the power of data to external audiences. Your team loves data - you can bet your customers and partners will too! When you bake analytics directly into your product, you simultaneously provide a way to prove your value and add a major engagement factor.
Native Analytics allows you to present nearly any modern analytics view, including engagement, activation, conversion, retention, segmentation, funnels, and more. If you can imagine it, you can probably build it on Keen.
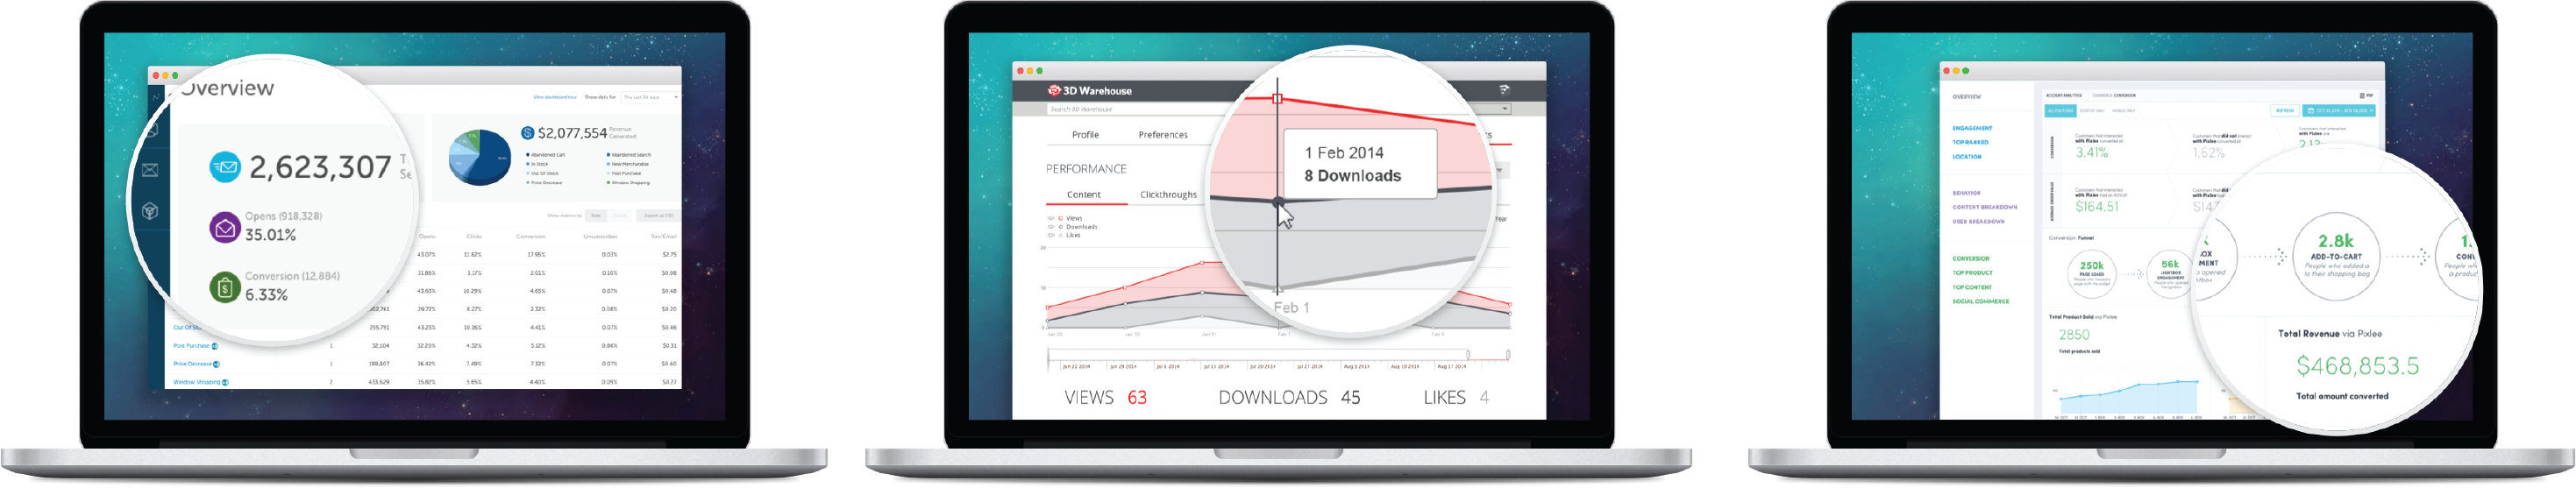
A common application for Native Analytics is building an analytics interface into a website or mobile app. The screenshots below show how Bluecore, Mic, and Pixlee have created totally unique interfaces for their teams and customers, all powered by Keen behind the scenes.
Key Features
What makes Native Analytics different from other analytics products?
- Embedded Charting Done Right
- Total Control of Data Presentation and Visualization
- Programmatic Account Creation
- Security Features
- Reports that load instantly
- True end-to-end white labeling for your brand
- A Robust Platform
Embedded charting done right
At the heart of the Native Analytics tool suite is the ability for developers to very quickly deploy beautiful charts and tables into their applications.
Within moments of collecting data, a developer can build a simple query and use the “Embed” button to grab the JavaScript code that can be used to securely display a chart natively on any app or website.
But, JavaScript isn’t the only way to access data. Because Keen’s platform is architected with intuitive REST APIs, you can query data from any app or platform, whether that be a smart device, a backend server, mobile app, or something totally new. With APIs, you can natively build analytics intelligence into anything connected to the internet.
This video shows building a query and then clicking embed button to see sample code which can be copy & pasted for embedding and white-labeling.
Finally, it’s worth noting that we believe that data and charts that you display in your application should truly feel like a part of your app, and not like something that you bolted on in a clunky iframe. Using Keen’s charting library is similar to using other common data viz libraries (in fact, our library simply wraps the most popular ones).
Total control over presentation and visualization
You can’t compromise on quality when it comes to your in-app experience. The look and feel of your data and data visualizations needs to be sharp and consistent with your brand.
Keen’s charting and visualization libraries do a ton of the legwork to get you up and running with nice charts, faster than ever. But we’ve also architected our libraries so that you have total control, including the ability to swap out a variety of open source charting libraries, or use your own.

Programmatic Account Creation
Need to deploy unique analytics views to 10,000 users? No problem. Native Analytics provisioning APIs allow you to deploy completely separate analytics accounts to thousands of customers at once, each with their own security and access controls. When new customers onboard, you can programmatically provision a new account for each of them. Projects created this way have all of the full-blown functionality of the Keen platform, and you can choose how much of that functionality you want to expose to your end user. At a minimum, each project has unique access keys for writing and querying events. You can also optionally create logins for your customers to access Keen directly, as well as setup data streaming to an S3 bucket of your choice. Check out the project creation docs.
Here’s an example CURL request to create a new customer project “Analytics for Company Z”.
$ curl https://api.keen.io/3.0/organizations/ORG_ID/projects \
  -H "Authorization: ORGANIZATION_KEY" \
  -H "Content-Type: application/json" \
  -d '{
        "name": "Analytics for Company Z",
        "users": [{"email": "admin@yourcompany.com"}],
        "preferences": {"s3_bucket_name": "<company_Z_data>"}
      }'
A successfully created project request returns project keys for sending data & querying that project.
{
    "name": "Analytics for Company Z",
    "api_keys": {
        "master": "<MASTER_API_KEY>",
        "read": "<READ_API_KEY>",
        "write": "<WRITE_API_KEY>"
    },
    "users": [{"email": "admin@yourcompany.com"}],
    "preferences": {"s3_bucket_name": "<S3_BUCKET_NAME>"}
}
Security Features
When you’re building data views into your product, security is incredibly important. You can’t risk customer A getting a peek at customer B’s data. There are number of features that help you secure data so that customers can only see the data that you intend. Every user project you generate on Keen has user access and user management capabilities. Additionally, Keen offers the ability to secure your queries via custom API access keys which further refines your data views.
Reports that load instantly
Modern app users expect screens and data to load instantly. Native Analytics caching capabilities allow you to retrieve pre-computed query results in milliseconds, so dashboards and reports load at lightning speed.
For example, you might create a query for the daily median price for the last 90 days. By specifying a refresh rate of 24 hours, you activate caching for this query. The query results will be stored and updated every 24 hours. Any report or dashboard that uses this query will be able to load that data instantly.
Example request which adds a refresh rate to the MEDIAN_PRICE_LAST_90_DAYS query:
$ curl https://api.keen.io/3.0/projects/PROJECT_ID/queries/saved/MEDIAN_PRICE_LAST_90_DAYS \
    -H "Authorization: MASTER_KEY" \
    -H 'Content-Type: application/json' \
    -X PUT \
    -d '{
            "refresh_rate": 14400
        }'
True end-to-end white labeling for your brand
Native Analytics gives you the ability to customize everything about your analytics implementation, from the way you describe your data to the way you design your visualizations and reports natively in your product.
You even have the option to white label event and query requests that you make to Keen. For example, you could have all of your POST requests go to “analytics.foxtrot.com” instead of “api.keen.io”. Ask us about “custom CNAMEs” to learn more.
A robust platform designed for lots of requests
One of the unique challenges of building analytics products is that the data volumes are often large and query patterns can be intense. When you’re presenting data to your customers, you can’t risk downtime, outages, and gaps in your data.
What would happen to your analytics database if 1,000 or even 100 people queried it at the same time? Many analytics products and in-house databases, designed for internal use, will unexpectedly hang, break, and sometimes even go down completely, causing data loss.
Keen’s analytics platform was designed from the start to handle large volumes of data and queries. Our platform engineers have spent years building robust rate limiting and failover mechanisms, and we staff a 24/7 oncall team. That’s why we’re able to offer a guaranteed uptime, and you can rest assured that your users can’t break us.
What’s Next?
Connect with our team to evaluate if Native Analytics is a good fit for your next project.
