Media Pageview Analytics
This guide will walk you through some common pageview metrics to track for your media website. With the right data we can answer questions like:
- Which journalists receive the most Pageviews?
- Which topics receive the most Pageviews?
- Which landing pages drive the most click-throughs to articles?
- Which day of the week receives the most total articles read?
- Which types of articles drive the most clicks on our sponsored ads?
With the right data we can dig into what kind of content is gaining traction and traffic, which content is popular, which content is generating ad revenue, etc. With event data, the information that you might track within a Pageview are only limited by your imagination.
Sample tracking plan
To get an idea of what tracking might look like, we will walk through a tracking plan for a sample media property in the guide.
Imagine you are a media company with a simple set of Article pages and Landing Pages for different topics. Articles represent a Page with a single Content Item that has an Author. A Content Item may have Keywords to help with engagement. A Landing Page represents a Topic that may be a collection of Content Items. You get the picture. Here’s an example:
On every Pageview, we will want to collect a set of properties. Some of the properties you might want to collect on each Pageview event include:
- topic
- title
- browser information
- external referrer -> how did the visitor get to our page?
- author
We’ve put together some sample code to show you what it might look like to collect this type of data. The following example is for a Landing Page view that a user has visited by following an external link to our media website:
Landing page view with external referrer
{
   "page":{
    "url":"/topics/scoops-and-scandals",
    "type":"Landing",
    "topic":{
      "id":10,
      "title":"Scoops and Scandals"
    }
  },
  "user_agent":{
    "browser":{
      "name":"Chrome",
      "version":"28.0.1500.95",
      "major":28
    },
    "engine":{
      "name":"WebKit",
      "version":"537.36"
    },
    "os":{
      "name":"Mac OS X",
      "version":"10.7.4"
    }
  },
  "referrer":{
    "type":"external",  "source":"http://www.referrer.com/some/ad?param1=foo\u0026param2=bar/#someplace",
    "protocol":"http",
    "domain":"www.referrer.com"
  },
  "session":{
    "session_id":"session-cookie",
    "unique_id":"unique-cookie"
  },
  "at":{
    "timestamp":"2015-06-24T07:44:27.737-07:00",
    "day_of_week":"Wednesday",
    "hour_of_day":7
  }
}
Article Pageview from an internal referrer
{
  "page":{
    "url":"/articles/learning-to-fly",
    "type":"Article",
    "author":"Danaerys Targaryen",
    "keywords":["espionage","investment"]
  },
  "user_agent":{
    "browser":{
      "name":"Chrome",
      "version":"28.0.1500.95",
      "major":28
    },
    "engine":{
      "name":"WebKit",
      "version":"537.36"
    },
    "os":{
      "name":"Mac OS X",
      "version":"10.7.4"
    }
  },
  "referrer":{
    "type":"internal",
    "source":"/topics/current-affairs",
    "keyword":"investment"
  },
  "session":{
    "session_id":"session-cookie",
    "unique_id":"unique-cookie"
  },
  "at":{
    "timestamp":"2015-06-24T07:45:27.900-07:00",
    "day_of_week":"Wednesday",
    "hour_of_day":7
  }
}
Remember that event data is not a row in a relational database, nor should you think of it that way. It is an extremely flexible collection of (hopefully) meaningful properties that describe the event (a Pageview event, for example), including the initiator of the event, the object that the event was “on” and anything else we might wish to add to support future analysis. (There is no cap on what can be put into a JSON structure for an event other than reasonable limits by programming languages and transport mechanisms - so record as much as you think you might need!)
Please refer to our pageview tracking guide for a primer on a Pageview data model and options for components like User Agent detection or Random ID generation for sessions.
Increasing ad revenue with the right questions
Many media companies use their pageview data to optimize their ad placements to generate revenue. Getting your data model right at the beginning will make analysis a lot less painful and a lot more useful. We always encourage our customers to keep the end in mind, to borrow from a famous habit, so having an idea of the questions you might like to ask will help make the event data modeling exercise easier.
For example, you might want to answer questions like:
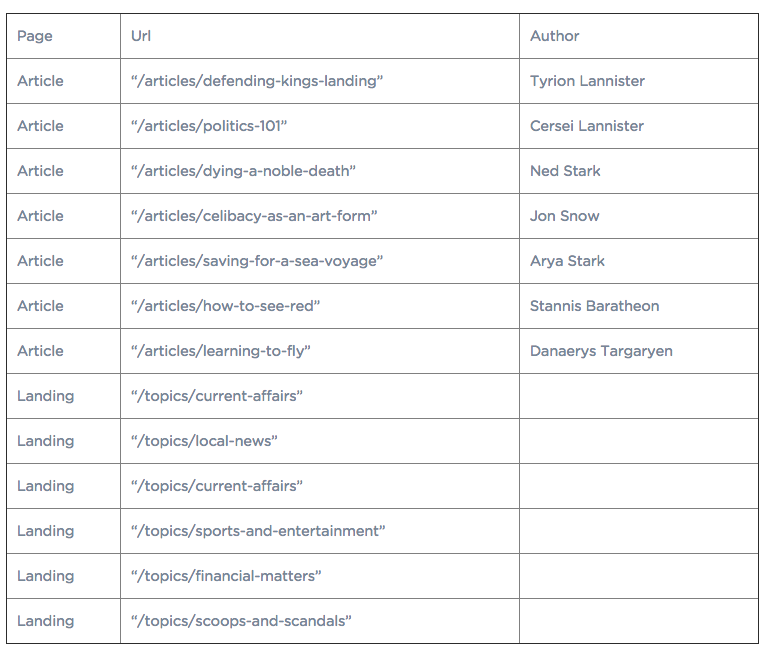
Which authors generate the most Pageviews?
This is now a very straightforward question and with the use of the Group By clause - https://keen.io/docs/api/#group-by - it is possible to have a single query obtain counts of Article Pageviews grouped by Author (for Articles, page.type being used as a Filter)
var client = new Keen({
  projectId: "PROJECT_ID",
  readKey: "READ_KEY"

});
Keen.ready(function(){
  var query = new Keen.Query("count", {
    event_collection: "page_views",
    timeframe: "this_14_days",
    filters: [
      {
        property_name:"page.type",
        operator:"eq",
        property_value:"Article"
      }
    ],
    group_by: "page.author",
    timezone: "UTC"
  });
  client.draw(query, document.getElementById("my_chart"), {
    // Custom configuration here
  });
});
We generated a random sample of media Pageviews for this exercise. Clearly, people want to know how Arya plans to cross the narrow sea.
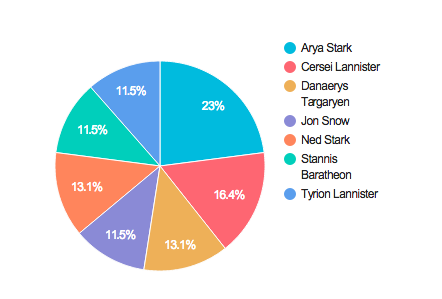
Which topics receive the most Pageviews?
This is always a very important question, particularly as you think about advertiser interest in topics and being able to have granular data to support both actual traffic numbers, how users are finding topics, and the translation to the economic value of ad impressions within topical areas.
Another Group By query, this time filtered for Landing pages, organized by Topic.
Keen.ready(function(){
  var query = new Keen.Query("count", {
    event_collection: "page_views",
    timeframe: "this_14_days",
    filters: [{"operator":"eq","property_name":"page.type","property_value":"Landing"}],
    group_by: "page.topic.title",
    timezone: "UTC"
  });
  client.draw(query, document.getElementById("my_chart"), {
    // Custom configuration here
  });
});
Of the 100 or so randomly generated Pageviews for our example, users seem to find Current Affairs, Local News, and Scoops and Scandals the most enticing. (Of course, juicy news is always juicy, even in an illustration!)
How much external traffic does each topic generate?
It might also be interesting to know how these Landing pages ranked with respect to incoming traffic, indicating the likely reach of these Topic pages.
Keen.ready(function(){
  var query = new Keen.Query("count", {
    event_collection: "page_views",
    timeframe: "this_14_days",
    filters: [{"operator":"eq","property_name":"page.type","property_value":"Landing"},{"operator":"eq","property_name":"referrer.type","property_value":"external"}],
    group_by: "page.topic.title",
    timezone: "UTC"
  });
  client.draw(query, document.getElementById("my_chart"), {
    // Custom configuration here
  });
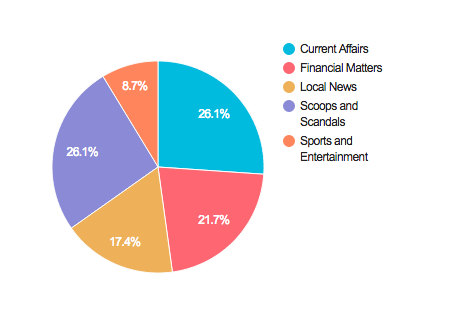
This particular query uses a concept of separating internal referrers from external referrers as an example. This is the type of addition to a Pageview event data model that might seem straightforward after the fact, but is a powerful indicator of the flexibility of defining your own event data when it comes to “Pageview” and not being constrained by a limited definition of a Pageview from a particular vendor’s analytics platform.
What day of week generates the most Pageviews?
This is often the burning question in ad pricing optimization, and it sometimes requires multiple downloads to spreadsheets and a lot organization to figure out.
By now you’re probably getting the drift: the more distinct properties you are able to associate with a Pageview, the more lines of questioning you can follow as you look for metrics to support your content and traffic monetization goals.
Keen.ready(function(){
  var query = new Keen.Query("count", {
    event_collection: "page_views",
    timeframe: "this_14_days",
    group_by: "at.day_of_week",
    timezone: "UTC"
  });
  client.draw(query, document.getElementById("my_chart"), {
    // Custom configuration here
  });
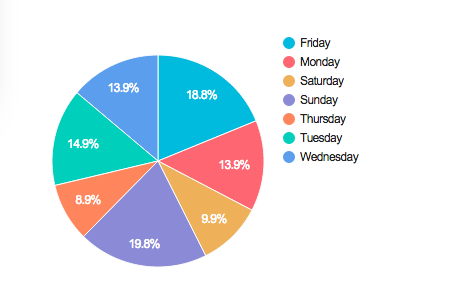
No surprise, our random Pageview generator indicates heavy Friday and Sunday usage in advance of the TV show.
Which “keywords” drive the most engagement?
Many media properties make heavy use of tags (keywords) to create more opportunities for users to engage with content.
But this is not only an indication of engagement. It can also become a key component for monetization. Imagine if you could not only present potential advertisers with traffic patterns and authors, but also “concepts” or “keywords” that the user base is engaging with, backed by solid metrics. Now the value of tagging articles becomes more evident.
Keen.ready(function(){
  var query = new Keen.Query("count", {
    event_collection: "page_views",
    timeframe: "this_14_days",
    filters: [{"operator":"eq","property_name":"referrer.type","property_value":"internal"}],
    group_by: "referrer.keyword",
    timezone: "UTC"
  });
  client.draw(query, document.getElementById("my_chart"), {
    // Custom configuration here
  });
})
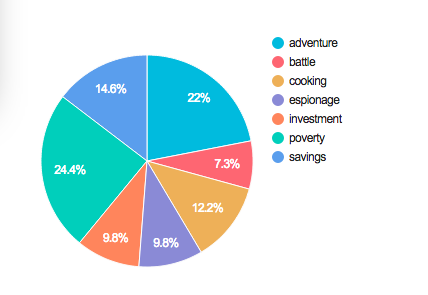
Can you imagine easily identifying not only that users want to read more from Arya Stark, but also seem motivated to explore “adventure” and “poverty”?
Not only does this type of analysis help make compelling cases for advertisers based on specific concepts, topics and keywords, but it also helps focus editorial efforts to continually exceed audience expectations.
We’ve only scratched the surface
We have only used one collection: Pageviews with a relatively simple structure. And we have only really used one type of query: a Count with a Group-By.
Here’s another question that could be asked:
Who’s our best “adventure” writer? (Why? Because their articles might be worthy of premium pricing.)
Keen.ready(function(){
  var query = new Keen.Query("count", {
    event_collection: "page_views",
    timeframe: "this_14_days",
    filters: [{"operator":"in","property_name":"referrer.keyword","property_value":["adventure"]},{"operator":"eq","property_name":"page.type","property_value":"Article"}],
    group_by: "page.author",
    timezone: "UTC"
  });
  client.draw(query, document.getElementById("my_chart"), {
    // Custom configuration here
  });
});
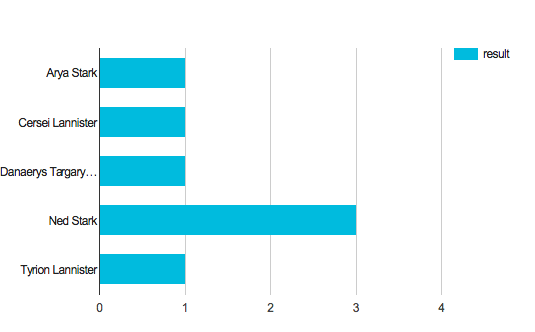
Ned Stark, from the afterlife, seems to have our readers’ attention, particularly if he were to talk about “adventure”!
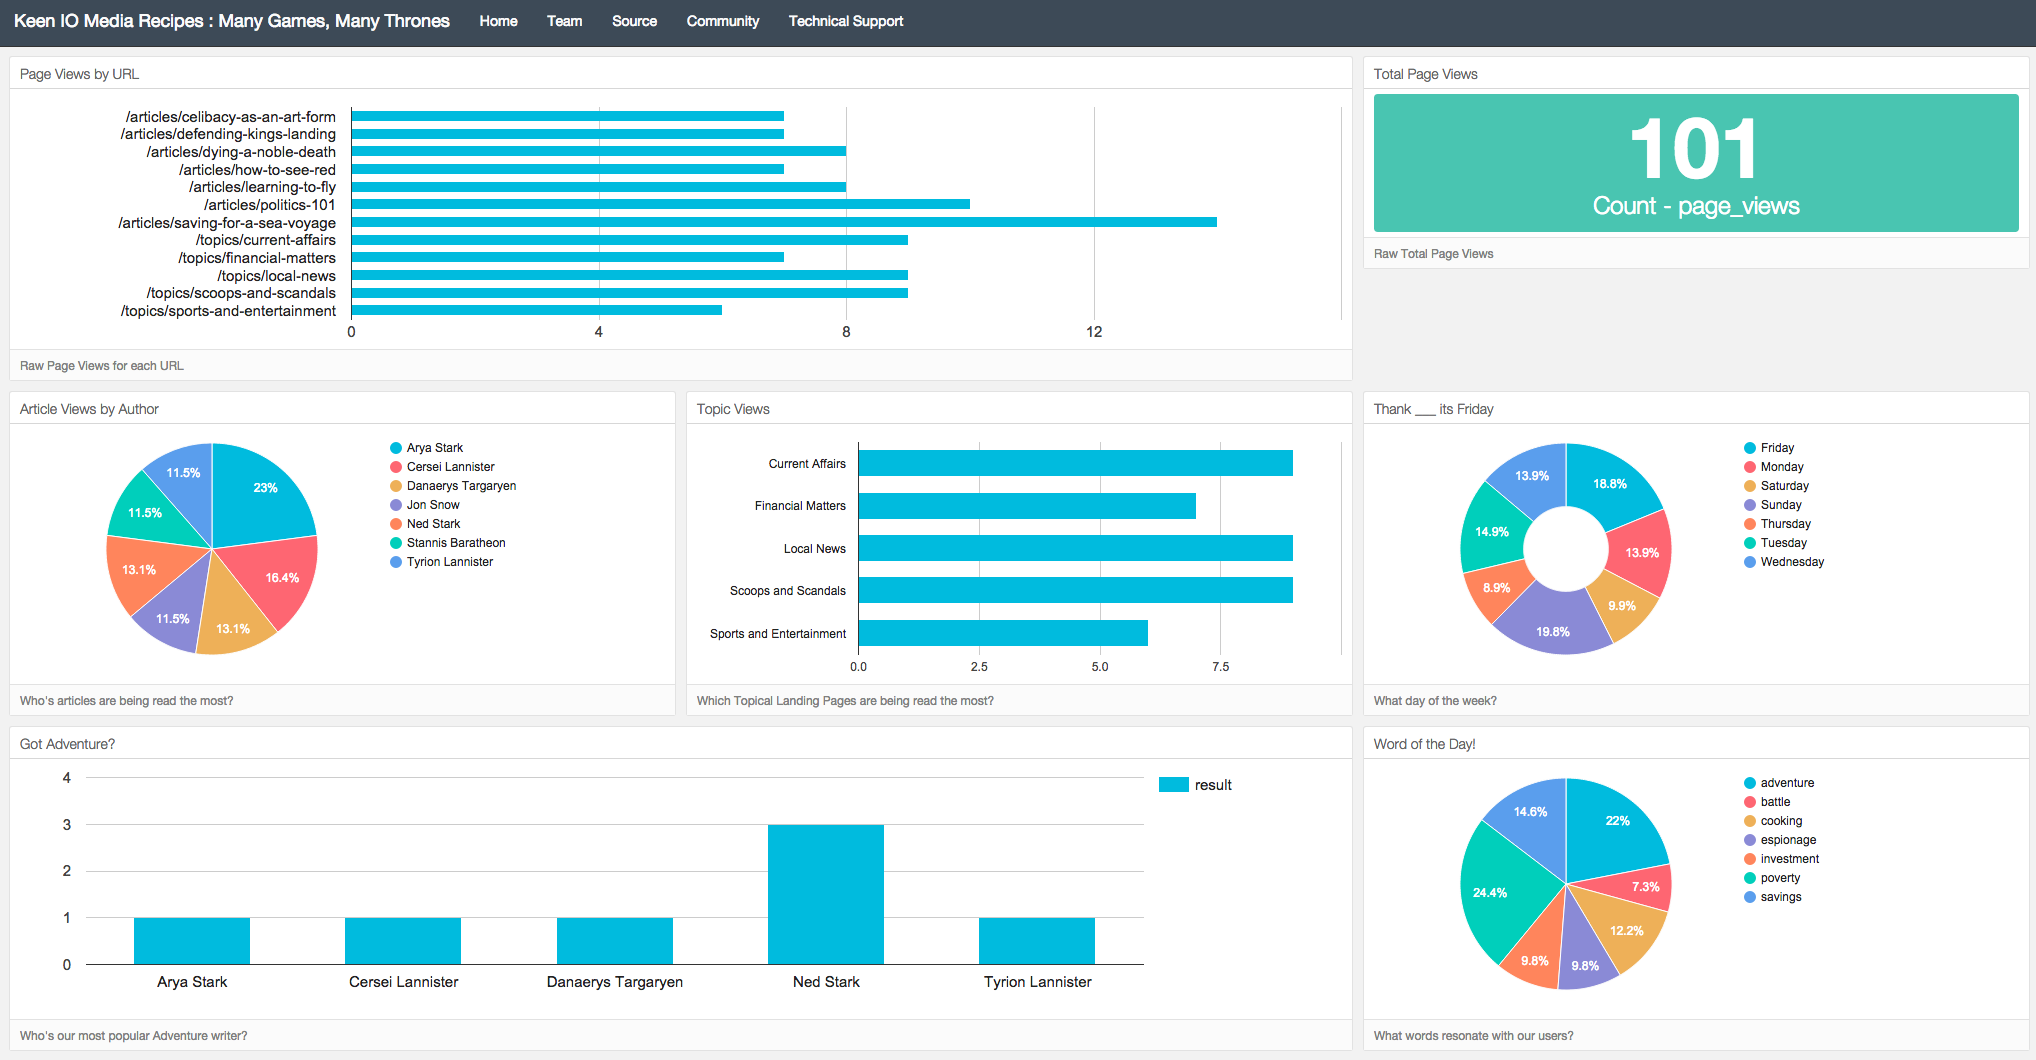
How can I visualize all of this in one place?
You can grab one of our easy-to-use dashboard templates and put all this together into a single view that provides visibility into the key metrics you’re looking for.
Outcomes:
We’ve just scratched the surface here, with the right tracking, you might discover that articles published on Tuesdays about the Apple iWatch garner 20x more Pageviews than any other article on your site. Armed with this data, you will be able to demand a premium from someone wanting to advertise on your site with a goal of a higher number of impressions. You might also discover that articles posted by journalist Jenny produce 10x more Pageviews than those by journalist Jessica.
What’s next?
We will continue to deliver ready-to-go recipes, guides, and data models for media so you can take the guesswork out of how to measure and report, and focus instead on how to delight and engage. We will look at things like tracking ad impressions, CTRs, and conversion rates so you can show your advertisers how their ads are doing. We’ll also look at optimizing ad placement by looking at how an ad performs when shown next to different types of articles.
If you’d like to learn more about media and advertising analytics, reach out to us to schedule a demo and free data consultation with our media data science team.
