Embedded Visualizations
Use Keen’s flexible presentation library to seamlessly embed and deliver metrics within your UI.
Get Started For FreeDeliver Beautiful Metrics
Keen’s visualization platform lets you deliver metrics to your customers that seamlessly match your product’s unique look and feel.

Keen’s visualization library includes all of the most popular chart types to get you up and running fast.

Keen’s Dashboard Creator makes it easy to create a custom look and feel that matches your application.

Our open source visualization library available on Github lets you fully customize your visualizations to build to spec.

Already have your own charting library? Our SDKs also support a wide range of 3rd party libraries like Chart.js and Highcharts.
Flexible Javascript visualization library
Use Keen to quickly build embeddable charts and dashboards within seconds of sending your data. We’ve got all the standard visualizations including area charts, line charts, bar charts, pie charts, tables, and more.
In addition to our own visualization library, Keen’s javascript SDKs are also designed to be compatible with any visualization, charting, or dashboarding library like Highcharts, D3, C3, Google Charts, and Chart.js.
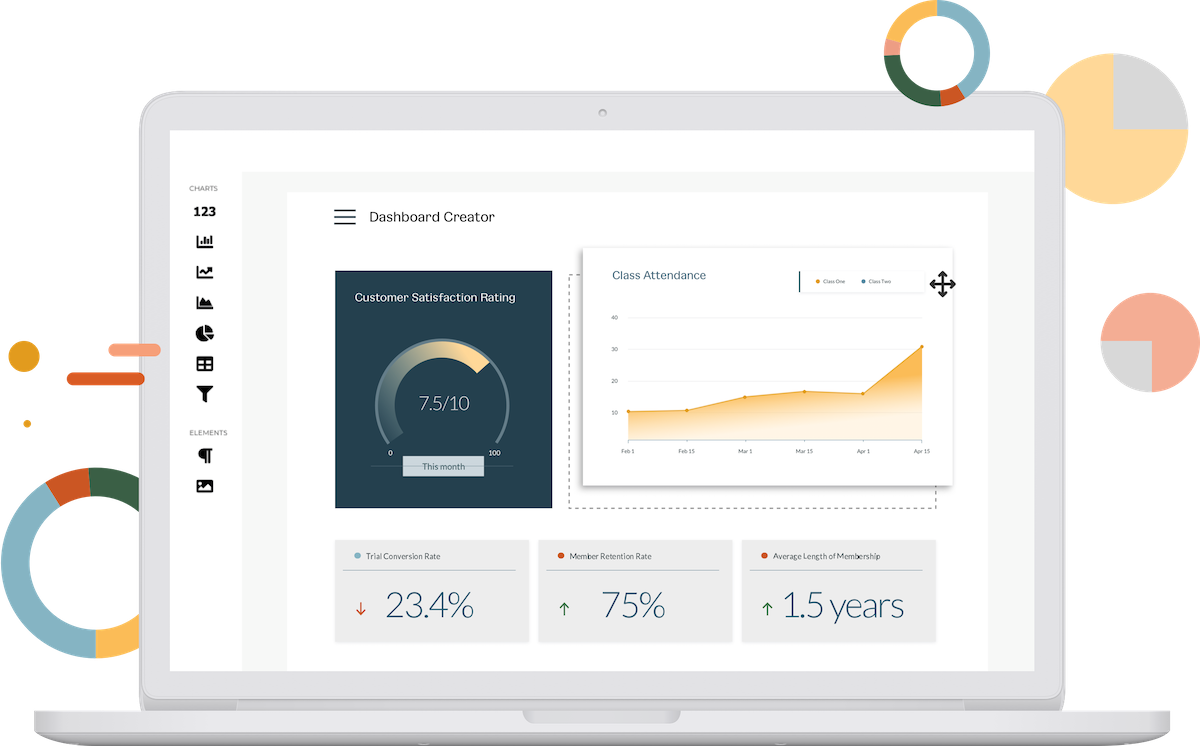
Dashboard Creator makes custom data visualization easy
Keen’s Dashboard Creator lets you create custom themes including colors and fonts to match your application. Build your reporting directly in the UI and export the code with a click of a button for easy integration.

“Keen saved us months of work building real-time analytics into our product. Our clients love seeing actionable insights as a native part of the user experience.”