
Quartz is one of the fastest growing media outlets on the Internet. When it came to delivering a new model in journalism, the Quartz team built charts to graphically explain the impact of the news they were reporting. These charts soon became an important asset to readers, so the editorial team developed Chartbuilder to quickly build beautiful charts. “Charts are a huge part of Quartz’s core product,” said John West, Growth Engineer at Quartz. “It’s how we tell stories in visually engaging ways. Charts are to Quartz what cat videos are to Buzzfeed.”
Charts are to Quartz what cat videos are to Buzzfeed.
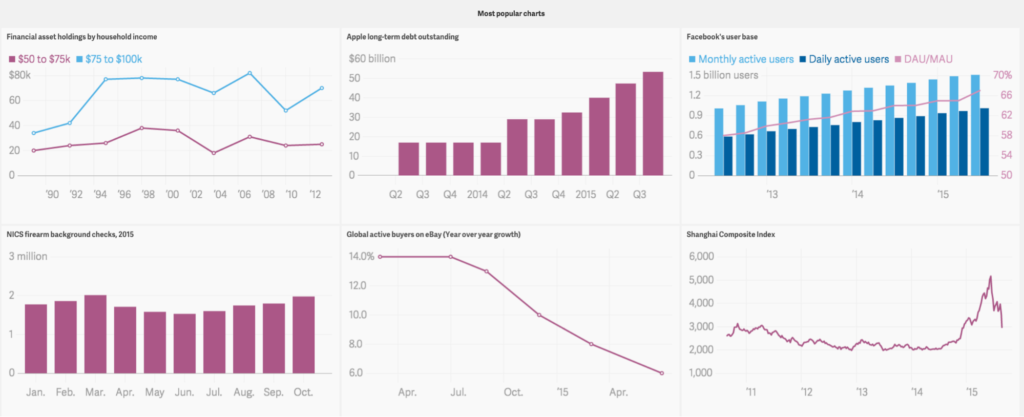
Tracking user engagement with viral content
Before long, the team realized their audience was distributing these charts in other places, so they built a new component, Atlas, which organizes the charts in one home but allows them to spread virally. Soon editors were producing charts that didn’t necessarily have stories attached. “Sometimes a story had 14 charts,” West explained. “Sometimes you just wanted the chart — you didn’t need the story — and so they thought a chart as a standalone piece of digestible content should be a thing we have a home for.”
The team realized they needed a way to track the charts and how users were interacting with and sharing them. Quartz turned to the Keen platform to build analytics behind Atlas. West explained, “A lot of it is basic stuff like how many people have seen this chart on an iPhone over the last three days, but we track hundreds of variables about how people are using charts, and then we detect and analyze patterns to make Atlas better. Charts on Atlas are also embeddable on qz.com, in our stories, and elsewhere on the web, and Keen lets us track them wherever they go.”
We track hundreds of variables about how people are using charts, and then we detect and analyze patterns to make Atlas better.
Leveraging a flexible platform to get granular insights
In order to track charts over the web, Quartz needed a platform that would be flexible enough to meet their needs. With Keen, the Quartz team can choose which metrics they consider important and then build a data structure around those metrics. “For Atlas, we don’t have a traditional, single pageview metric. We care about how many charts were viewed, and we have how many archived pages on Atlas at qz.com were viewed. We don’t have ‘this is a page and this is how many times that page was viewed’ because that’s a legacy way of thinking about web apps that isn’t relevant to Atlas,” he said.
Keen allows us to construct our data model in a way that privileges the metrics we care about. With other programs, we would have constant constraints that would greatly limit what we were hoping to achieve. For me I think that’s one of the biggest reasons we ended up going with Keen.
Planning next steps
For Quartz, Atlas is a big competitive differentiator and they have large plans for it as well as for their use of Keen. “We’re working now on instrumenting the entirety of qz.com, so in addition to having analytics embedded in charts — where we’re tracking things like whether a user sees them — we want to track lots of other actions on the site, like whether people are seeing articles, reading them, spending time on them, sharing the article or signing up for an email, newsletter, etc. And Keen will help us do all of this,” West concluded.


