
Today, more than 217 million people worldwide listen to music on Spotify. However, thanks in part to Spotify metrics, music listeners aren’t the only “customer” that the platform serves.
Through the app, the musicians that are hosting their music on the software have access to more data about the people listening to their music than ever before. Over the last several years, the company has put significant time and energy into building a simple and clean interface that provides artists with a ton of useful information that can help them increase their fanbase and number of listens for their songs.
By way of the Spotify dashboard, the software’s developers are showing everyone how customer-facing metrics can enhance their artists’ experience with the platform.
Delivered Through the Front-end Experience
Years ago, artists were limited to managing a few details about their public-facing profiles. Musicians could update their biographies, add images, and highlight playlists that they had created. While that is wonderful for branding, it doesn’t help an artist actively grow their fanbase.
Now, when musicians log into the Spotify artist dashboard within the app, they are given access to valuable snapshots of data. Without having to navigate elsewhere, artists can see critical information, such as how many fans are currently listening to their music, and get insights about the last seven days of listener activity.
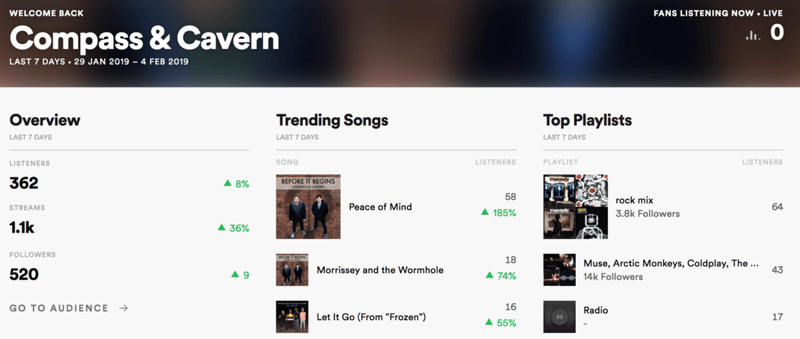
On the left is an overview that shows how many listeners, streams, and followers engaged with the artist’s music over the course of a week. The dashboard also indicates how these Spotify metrics compare to the previous week’s data using color-coded percentages (green = good, red = bad). In the middle column, artists see their most popular songs for the last week and how many listens each received. On the right is a summary of which playlists are garnering the most listens.
For each of these data categories, users can go even deeper to get a better understanding of the demographics and listening preferences of their fans.
Easy-to-Digest Visuals & Graphics
Spotify understands that a vast majority of musicians aren’t interested in manipulating data and creating custom dashboards. They want valuable information about their fans without having to work for it.
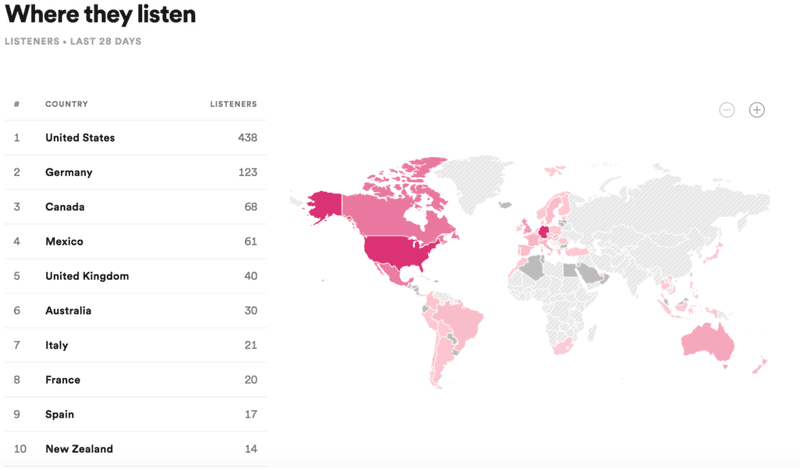
Spotify has mastered the art of delivering customer-facing metrics in a way that is extremely easy for artists to understand. Take the following image, for example. In a matter of seconds, users can synthesize the geographic information that is being portrayed by the table.
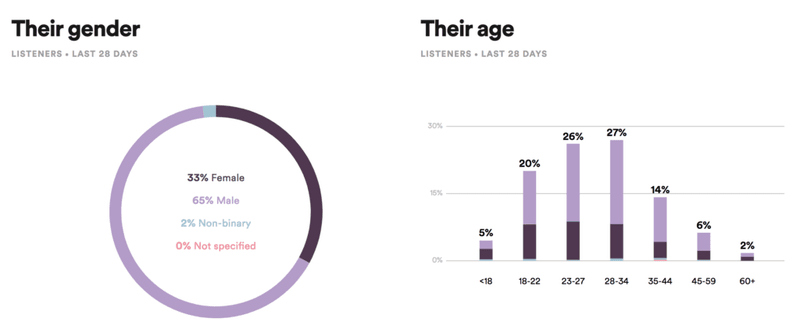
The platform’s graphs are also straightforward. With a little color coding, basic legends, and a lot of white space, Spotify delivers metrics in a non-intimidating and meaningful, and therefore actionable, way.

With Spotify’s data, an artist can develop targeted promotion campaigns and optimize how they deploy their own resources. For example, an artist might use the table below to determine that it would be beneficial to run a Facebook ad campaign in Denver given that they have many listeners in that city. Simply put, customer-facing metrics can help musicians to make more well-informed decisions on where and when to advertise.

Near-Real-Time Data
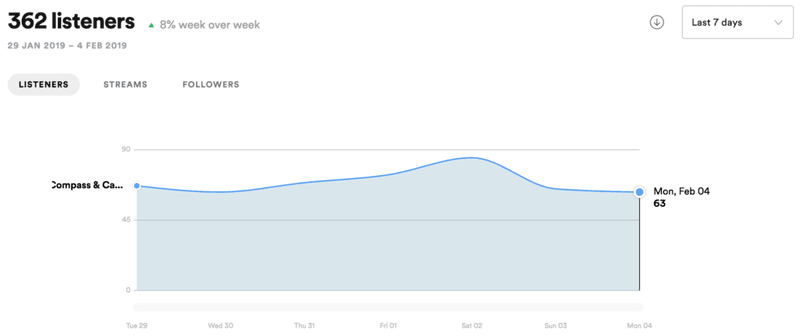
One of the most beneficial aspects of Spotify’s customer-facing metrics is the near-real-time nature of the data that is available. Spotify metrics show highly nuanced data up to the current day.
The platform also now allows artists to submit new songs for playlist consideration before they are released. If a playlist curator decides to add an artist’s song to a Spotify-branded playlist, the musician will receive a notification on release day encouraging them to discover their new fans.
As a result, artists can determine where they are trending in real-time which may help them to convert random listeners into loyal fans when they are most excited about their music.
Overall, this enables Spotify to create a superior product experience for artist users while simultaneously highlighting the value of the platform itself.
Deploying Customer-facing Metrics For Your Customers
Spotify has become a leading example of how to deploy customer-facing metrics well in the current digital age. By doing so, the platform creates tremendous incremental value for artists. Through seamlessly delivered customer-facing metrics, Spotify has built a loyal base of musician users who now consider the platform to be an integral part of their success.
With Keen, creating customer-facing dashboards like those used to display Spotify metrics for their own customers is easy. To learn more about how we can help you take your applications and software to the next level and maximize the value delivered to your users and end-users, talk to our solutions team today.

This article was originally published February 2019 and was updated January 2020.


