Need to monitor your app activity based on location? The geo-explorer dashboard is a fun and interactive way to take a different look at your data. (You might remember it as part of our open source dashboard repo that launched a few weeks ago.)
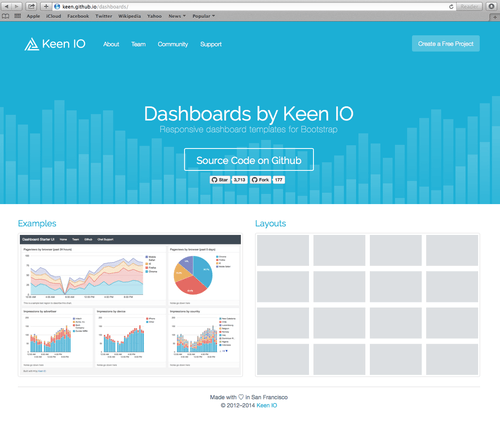
The dashboard repo shipped with several examples, but the geo-explorer dashboard in particular spurred a lot of questions and excitement, so we thought it might be worth more of a deep dive.
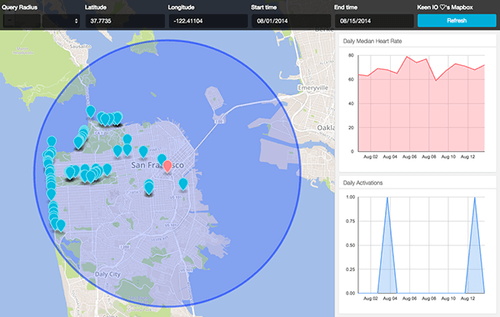
The geo-explorer makes it super easy to visualize user activity by location. Using the Mapbox JavaScript API and Keen’s own geo-filtering capabilities, you can create an interactive dashboard that updates a set of charts as you navigate the globe.
What sort of things can you monitor with this functionality? What about app usage stats during geographically significant events, like concerts or festivals? Or device activations in key cities or regions corresponding to a product launch!
If you’re already tracking your data in Keen, you can enable this functionality with two quick steps:
1. Include a location with each event:
{
    "keen": {
        "timestamp": "2012-12-14T20:24:01.123000+00:00",
        "location": {
            "coordinates": [ -88.21337, 40.11041 ]
        }
    }
}
2. Include this filter with each query:
{
    "property_name" : "keen.location.coordinates",
    "operator" : "within",
    "property_value" : {
        "coordinates":[, ],
        "max_distance_miles": ,
    }
}
We spent some time streamlining both the interface and the source code for geo-explorer, making it much easier to reason about and customize this cool little app. All browsing parameters, including pan and zoom state, are persisted in the URL, making it possible to bookmark or share specific geographic snapshots.
If you’re not tracking your data in Keen, go ahead and request a demo to learn how to start tracking events right away. The sample data powering this demo includes geo coordinates (which make this sort of analysis possible), so feel free to reuse this project to build and demo apps of your own.
Like we said, the geo-explorer is part of our open source dashboards project, which just passed 3.7k stars on Github! (It even spent a few days as the #1 trending repo!) DANG! We knew this project would be helpful, but we had no idea what was coming. Thank you all so much for helping us spread the word!

Get in touch if you have any questions about the geo-explorer, or if you have any feedback or suggestions! Happy hacking!


